Ghanaian vs Uruguayan Receiving Food Stamps
COMPARE
Ghanaian
Uruguayan
Receiving Food Stamps
Receiving Food Stamps Comparison
Ghanaians
Uruguayans
14.0%
RECEIVING FOOD STAMPS
0.5/ 100
METRIC RATING
252nd/ 347
METRIC RANK
11.8%
RECEIVING FOOD STAMPS
44.8/ 100
METRIC RATING
180th/ 347
METRIC RANK
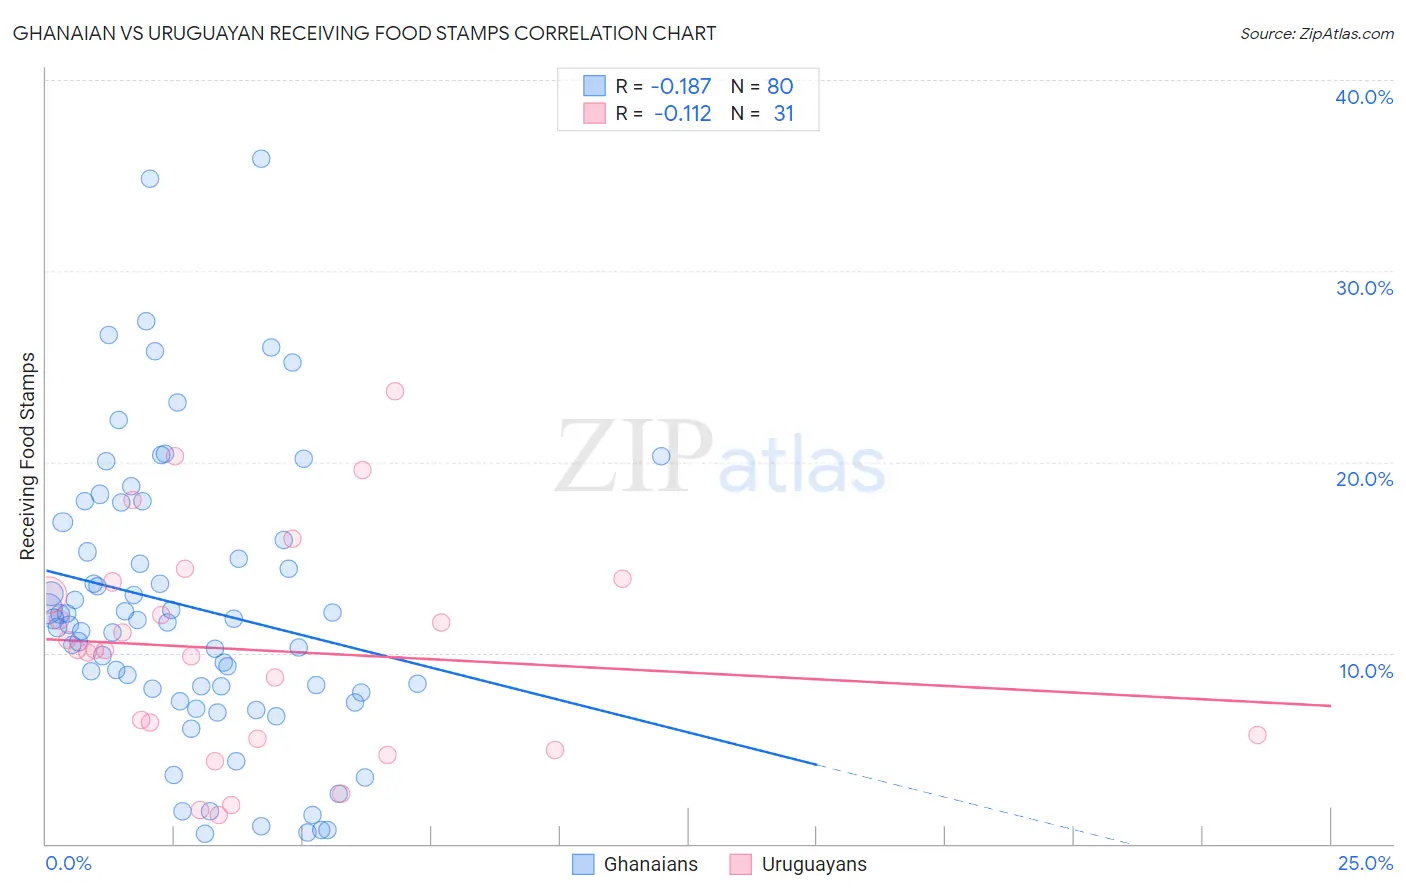
Ghanaian vs Uruguayan Receiving Food Stamps Correlation Chart
The statistical analysis conducted on geographies consisting of 190,218,153 people shows a poor negative correlation between the proportion of Ghanaians and percentage of population receiving government assistance and/or food stamps in the United States with a correlation coefficient (R) of -0.187 and weighted average of 14.0%. Similarly, the statistical analysis conducted on geographies consisting of 144,715,533 people shows a poor negative correlation between the proportion of Uruguayans and percentage of population receiving government assistance and/or food stamps in the United States with a correlation coefficient (R) of -0.112 and weighted average of 11.8%, a difference of 18.0%.
Receiving Food Stamps Correlation Summary
| Measurement | Ghanaian | Uruguayan |
| Minimum | 0.50% | 1.5% |
| Maximum | 35.9% | 23.7% |
| Range | 35.4% | 22.2% |
| Mean | 12.4% | 10.1% |
| Median | 11.6% | 10.1% |
| Interquartile 25% (IQ1) | 8.0% | 5.5% |
| Interquartile 75% (IQ3) | 16.4% | 13.7% |
| Interquartile Range (IQR) | 8.3% | 8.2% |
| Standard Deviation (Sample) | 7.6% | 5.7% |
| Standard Deviation (Population) | 7.5% | 5.6% |
Similar Demographics by Receiving Food Stamps
Demographics Similar to Ghanaians by Receiving Food Stamps
In terms of receiving food stamps, the demographic groups most similar to Ghanaians are Spanish American (14.0%, a difference of 0.37%), Yaqui (13.9%, a difference of 0.44%), Immigrants from Cambodia (13.9%, a difference of 0.52%), Indonesian (13.9%, a difference of 0.69%), and Marshallese (14.1%, a difference of 0.97%).
| Demographics | Rating | Rank | Receiving Food Stamps |
| Immigrants | Somalia | 0.9 /100 | #245 | Tragic 13.7% |
| Cree | 0.8 /100 | #246 | Tragic 13.7% |
| Mexican American Indians | 0.7 /100 | #247 | Tragic 13.8% |
| Immigrants | Laos | 0.7 /100 | #248 | Tragic 13.8% |
| Indonesians | 0.6 /100 | #249 | Tragic 13.9% |
| Immigrants | Cambodia | 0.5 /100 | #250 | Tragic 13.9% |
| Yaqui | 0.5 /100 | #251 | Tragic 13.9% |
| Ghanaians | 0.5 /100 | #252 | Tragic 14.0% |
| Spanish Americans | 0.4 /100 | #253 | Tragic 14.0% |
| Marshallese | 0.3 /100 | #254 | Tragic 14.1% |
| Sub-Saharan Africans | 0.3 /100 | #255 | Tragic 14.1% |
| Japanese | 0.3 /100 | #256 | Tragic 14.1% |
| Arapaho | 0.3 /100 | #257 | Tragic 14.1% |
| Immigrants | Ghana | 0.3 /100 | #258 | Tragic 14.1% |
| Creek | 0.3 /100 | #259 | Tragic 14.1% |
Demographics Similar to Uruguayans by Receiving Food Stamps
In terms of receiving food stamps, the demographic groups most similar to Uruguayans are Immigrants from Kenya (11.8%, a difference of 0.22%), South American Indian (11.9%, a difference of 0.44%), German Russian (11.8%, a difference of 0.46%), Immigrants from Ukraine (11.8%, a difference of 0.50%), and Immigrants from Morocco (11.9%, a difference of 0.59%).
| Demographics | Rating | Rank | Receiving Food Stamps |
| Immigrants | Syria | 53.4 /100 | #173 | Average 11.7% |
| Immigrants | Eritrea | 50.0 /100 | #174 | Average 11.7% |
| Osage | 49.8 /100 | #175 | Average 11.7% |
| Peruvians | 49.3 /100 | #176 | Average 11.7% |
| Immigrants | Ukraine | 48.4 /100 | #177 | Average 11.8% |
| German Russians | 48.1 /100 | #178 | Average 11.8% |
| Immigrants | Kenya | 46.4 /100 | #179 | Average 11.8% |
| Uruguayans | 44.8 /100 | #180 | Average 11.8% |
| South American Indians | 41.7 /100 | #181 | Average 11.9% |
| Immigrants | Morocco | 40.7 /100 | #182 | Average 11.9% |
| Immigrants | Uganda | 40.3 /100 | #183 | Average 11.9% |
| Spaniards | 39.8 /100 | #184 | Fair 11.9% |
| Immigrants | Iraq | 37.1 /100 | #185 | Fair 12.0% |
| Spanish | 36.9 /100 | #186 | Fair 12.0% |
| Albanians | 35.4 /100 | #187 | Fair 12.0% |