British West Indian vs Maltese Receiving Food Stamps
COMPARE
British West Indian
Maltese
Receiving Food Stamps
Receiving Food Stamps Comparison
British West Indians
Maltese
17.9%
RECEIVING FOOD STAMPS
0.0/ 100
METRIC RATING
324th/ 347
METRIC RANK
8.9%
RECEIVING FOOD STAMPS
99.9/ 100
METRIC RATING
14th/ 347
METRIC RANK
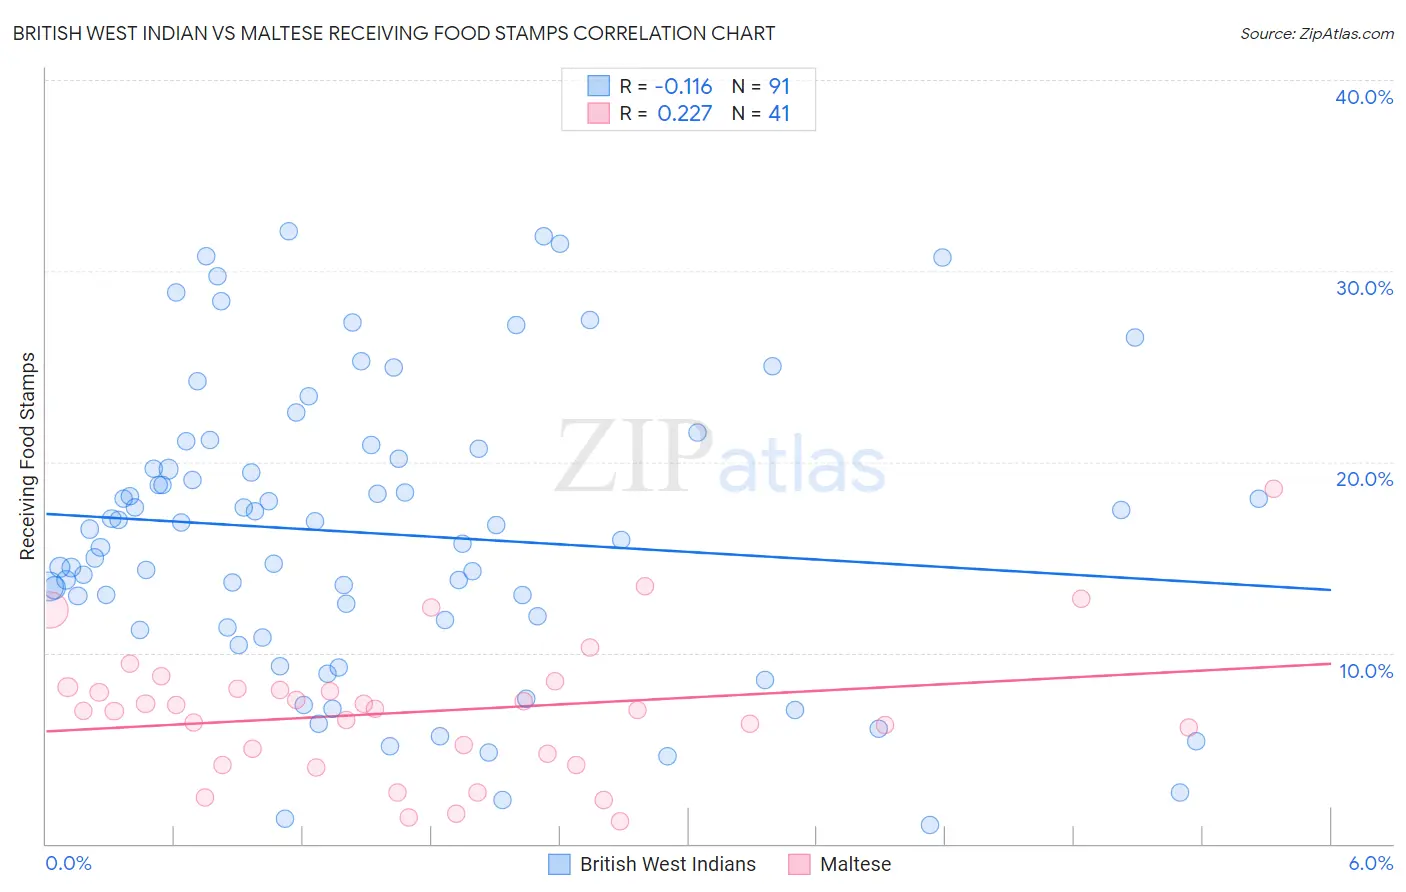
British West Indian vs Maltese Receiving Food Stamps Correlation Chart
The statistical analysis conducted on geographies consisting of 152,421,558 people shows a poor negative correlation between the proportion of British West Indians and percentage of population receiving government assistance and/or food stamps in the United States with a correlation coefficient (R) of -0.116 and weighted average of 17.9%. Similarly, the statistical analysis conducted on geographies consisting of 126,326,632 people shows a weak positive correlation between the proportion of Maltese and percentage of population receiving government assistance and/or food stamps in the United States with a correlation coefficient (R) of 0.227 and weighted average of 8.9%, a difference of 101.0%.
Receiving Food Stamps Correlation Summary
| Measurement | British West Indian | Maltese |
| Minimum | 1.0% | 1.2% |
| Maximum | 32.1% | 18.6% |
| Range | 31.1% | 17.4% |
| Mean | 16.2% | 6.9% |
| Median | 16.5% | 7.0% |
| Interquartile 25% (IQ1) | 11.3% | 4.4% |
| Interquartile 75% (IQ3) | 20.7% | 8.2% |
| Interquartile Range (IQR) | 9.4% | 3.8% |
| Standard Deviation (Sample) | 7.6% | 3.6% |
| Standard Deviation (Population) | 7.5% | 3.5% |
Similar Demographics by Receiving Food Stamps
Demographics Similar to British West Indians by Receiving Food Stamps
In terms of receiving food stamps, the demographic groups most similar to British West Indians are Immigrants from Grenada (17.8%, a difference of 0.59%), Haitian (17.8%, a difference of 0.59%), Immigrants from Haiti (18.2%, a difference of 1.8%), Cuban (18.2%, a difference of 1.9%), and Apache (18.3%, a difference of 2.2%).
| Demographics | Rating | Rank | Receiving Food Stamps |
| Blacks/African Americans | 0.0 /100 | #317 | Tragic 17.2% |
| Menominee | 0.0 /100 | #318 | Tragic 17.2% |
| Immigrants | St. Vincent and the Grenadines | 0.0 /100 | #319 | Tragic 17.2% |
| Immigrants | Nicaragua | 0.0 /100 | #320 | Tragic 17.2% |
| Natives/Alaskans | 0.0 /100 | #321 | Tragic 17.3% |
| Immigrants | Grenada | 0.0 /100 | #322 | Tragic 17.8% |
| Haitians | 0.0 /100 | #323 | Tragic 17.8% |
| British West Indians | 0.0 /100 | #324 | Tragic 17.9% |
| Immigrants | Haiti | 0.0 /100 | #325 | Tragic 18.2% |
| Cubans | 0.0 /100 | #326 | Tragic 18.2% |
| Apache | 0.0 /100 | #327 | Tragic 18.3% |
| Colville | 0.0 /100 | #328 | Tragic 18.3% |
| Immigrants | Dominica | 0.0 /100 | #329 | Tragic 18.4% |
| Pima | 0.0 /100 | #330 | Tragic 19.0% |
| Immigrants | Caribbean | 0.0 /100 | #331 | Tragic 19.6% |
Demographics Similar to Maltese by Receiving Food Stamps
In terms of receiving food stamps, the demographic groups most similar to Maltese are Bulgarian (8.9%, a difference of 0.13%), Okinawan (8.9%, a difference of 0.33%), Cypriot (8.9%, a difference of 0.33%), Norwegian (9.0%, a difference of 0.66%), and Immigrants from South Central Asia (8.8%, a difference of 0.77%).
| Demographics | Rating | Rank | Receiving Food Stamps |
| Immigrants | Iran | 100.0 /100 | #7 | Exceptional 8.3% |
| Burmese | 99.9 /100 | #8 | Exceptional 8.6% |
| Immigrants | Korea | 99.9 /100 | #9 | Exceptional 8.7% |
| Immigrants | South Central Asia | 99.9 /100 | #10 | Exceptional 8.8% |
| Okinawans | 99.9 /100 | #11 | Exceptional 8.9% |
| Cypriots | 99.9 /100 | #12 | Exceptional 8.9% |
| Bulgarians | 99.9 /100 | #13 | Exceptional 8.9% |
| Maltese | 99.9 /100 | #14 | Exceptional 8.9% |
| Norwegians | 99.9 /100 | #15 | Exceptional 9.0% |
| Immigrants | Japan | 99.9 /100 | #16 | Exceptional 9.0% |
| Immigrants | Scotland | 99.9 /100 | #17 | Exceptional 9.0% |
| Danes | 99.9 /100 | #18 | Exceptional 9.0% |
| Immigrants | Hong Kong | 99.8 /100 | #19 | Exceptional 9.1% |
| Latvians | 99.8 /100 | #20 | Exceptional 9.1% |
| Luxembourgers | 99.8 /100 | #21 | Exceptional 9.1% |