Hawaiian vs Immigrants from Zaire Receiving Food Stamps
COMPARE
Hawaiian
Immigrants from Zaire
Receiving Food Stamps
Receiving Food Stamps Comparison
Hawaiians
Immigrants from Zaire
12.9%
RECEIVING FOOD STAMPS
5.4/ 100
METRIC RATING
218th/ 347
METRIC RANK
13.4%
RECEIVING FOOD STAMPS
1.9/ 100
METRIC RATING
235th/ 347
METRIC RANK
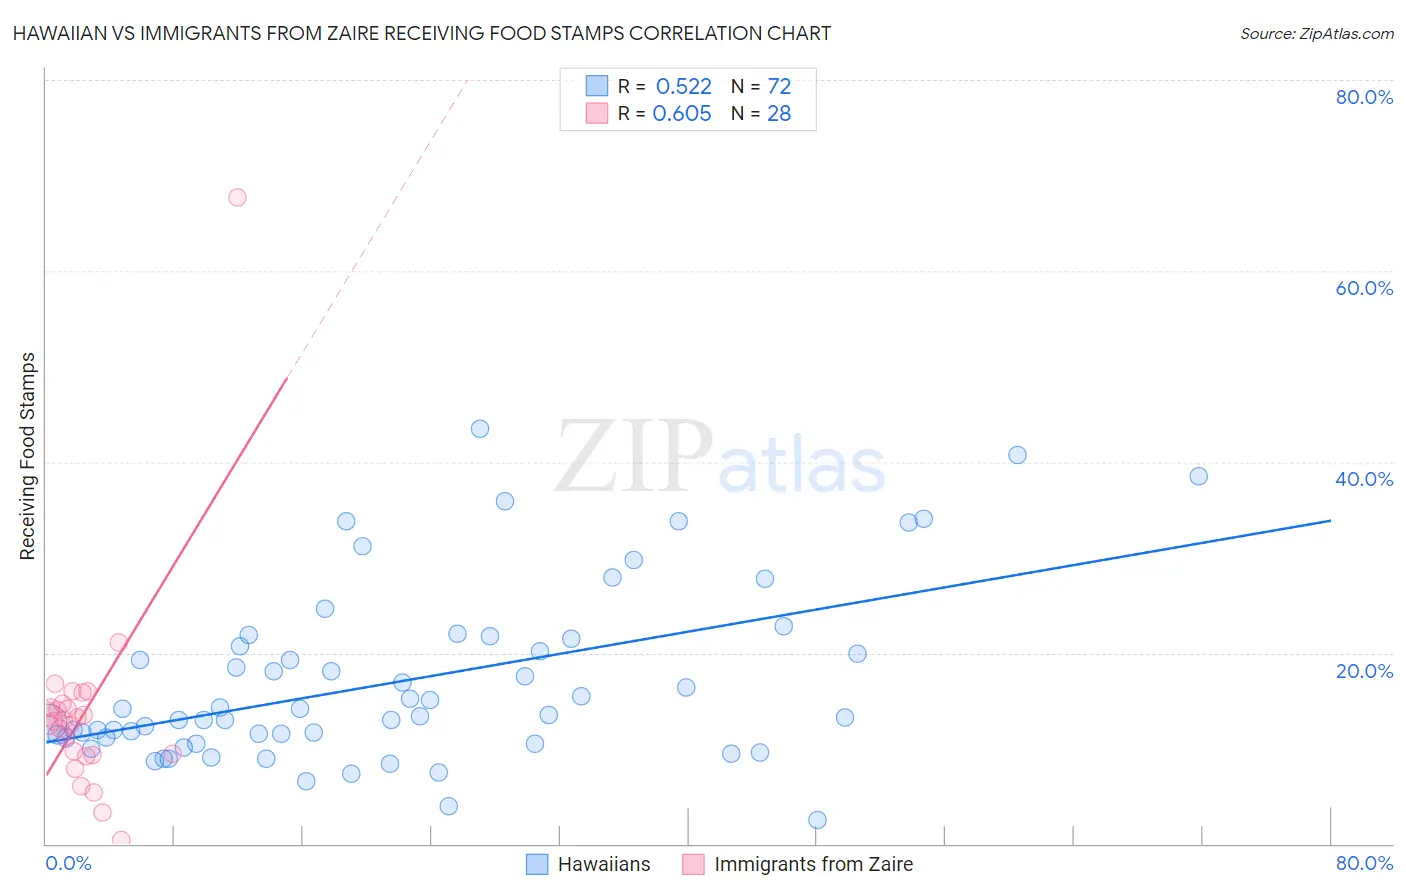
Hawaiian vs Immigrants from Zaire Receiving Food Stamps Correlation Chart
The statistical analysis conducted on geographies consisting of 327,058,596 people shows a substantial positive correlation between the proportion of Hawaiians and percentage of population receiving government assistance and/or food stamps in the United States with a correlation coefficient (R) of 0.522 and weighted average of 12.9%. Similarly, the statistical analysis conducted on geographies consisting of 107,223,376 people shows a significant positive correlation between the proportion of Immigrants from Zaire and percentage of population receiving government assistance and/or food stamps in the United States with a correlation coefficient (R) of 0.605 and weighted average of 13.4%, a difference of 3.5%.
Receiving Food Stamps Correlation Summary
| Measurement | Hawaiian | Immigrants from Zaire |
| Minimum | 2.5% | 0.40% |
| Maximum | 43.5% | 67.7% |
| Range | 41.0% | 67.3% |
| Mean | 17.0% | 13.7% |
| Median | 13.4% | 12.9% |
| Interquartile 25% (IQ1) | 11.1% | 9.3% |
| Interquartile 75% (IQ3) | 21.1% | 14.5% |
| Interquartile Range (IQR) | 10.0% | 5.1% |
| Standard Deviation (Sample) | 9.1% | 11.4% |
| Standard Deviation (Population) | 9.1% | 11.2% |
Demographics Similar to Hawaiians and Immigrants from Zaire by Receiving Food Stamps
In terms of receiving food stamps, the demographic groups most similar to Hawaiians are Immigrants from Middle Africa (12.9%, a difference of 0.010%), Immigrants from Colombia (12.9%, a difference of 0.050%), Immigrants from Burma/Myanmar (12.9%, a difference of 0.37%), Bermudan (13.0%, a difference of 0.37%), and Immigrants from South America (12.8%, a difference of 0.63%). Similarly, the demographic groups most similar to Immigrants from Zaire are Crow (13.4%, a difference of 0.44%), Comanche (13.3%, a difference of 0.77%), Cherokee (13.2%, a difference of 0.90%), Salvadoran (13.2%, a difference of 1.1%), and Immigrants from Nigeria (13.1%, a difference of 1.9%).
| Demographics | Rating | Rank | Receiving Food Stamps |
| Immigrants | South America | 6.5 /100 | #216 | Tragic 12.8% |
| Immigrants | Burma/Myanmar | 6.0 /100 | #217 | Tragic 12.9% |
| Hawaiians | 5.4 /100 | #218 | Tragic 12.9% |
| Immigrants | Middle Africa | 5.4 /100 | #219 | Tragic 12.9% |
| Immigrants | Colombia | 5.3 /100 | #220 | Tragic 12.9% |
| Bermudans | 4.8 /100 | #221 | Tragic 13.0% |
| Immigrants | Immigrants | 4.4 /100 | #222 | Tragic 13.0% |
| Immigrants | Albania | 4.4 /100 | #223 | Tragic 13.0% |
| Immigrants | Armenia | 4.3 /100 | #224 | Tragic 13.0% |
| Fijians | 4.3 /100 | #225 | Tragic 13.0% |
| Chickasaw | 3.6 /100 | #226 | Tragic 13.1% |
| Nigerians | 3.5 /100 | #227 | Tragic 13.1% |
| Panamanians | 3.5 /100 | #228 | Tragic 13.1% |
| Ottawa | 3.5 /100 | #229 | Tragic 13.1% |
| Puget Sound Salish | 3.4 /100 | #230 | Tragic 13.1% |
| Immigrants | Nigeria | 3.4 /100 | #231 | Tragic 13.1% |
| Salvadorans | 2.7 /100 | #232 | Tragic 13.2% |
| Cherokee | 2.5 /100 | #233 | Tragic 13.2% |
| Comanche | 2.4 /100 | #234 | Tragic 13.3% |
| Immigrants | Zaire | 1.9 /100 | #235 | Tragic 13.4% |
| Crow | 1.6 /100 | #236 | Tragic 13.4% |