Hopi vs Haitian Female Poverty Among 18-24 Year Olds
COMPARE
Hopi
Haitian
Female Poverty Among 18-24 Year Olds
Female Poverty Among 18-24 Year Olds Comparison
Hopi
Haitians
28.2%
FEMALE POVERTY AMONG 18-24 YEAR OLDS
0.0/ 100
METRIC RATING
338th/ 347
METRIC RANK
19.0%
FEMALE POVERTY AMONG 18-24 YEAR OLDS
98.9/ 100
METRIC RATING
93rd/ 347
METRIC RANK
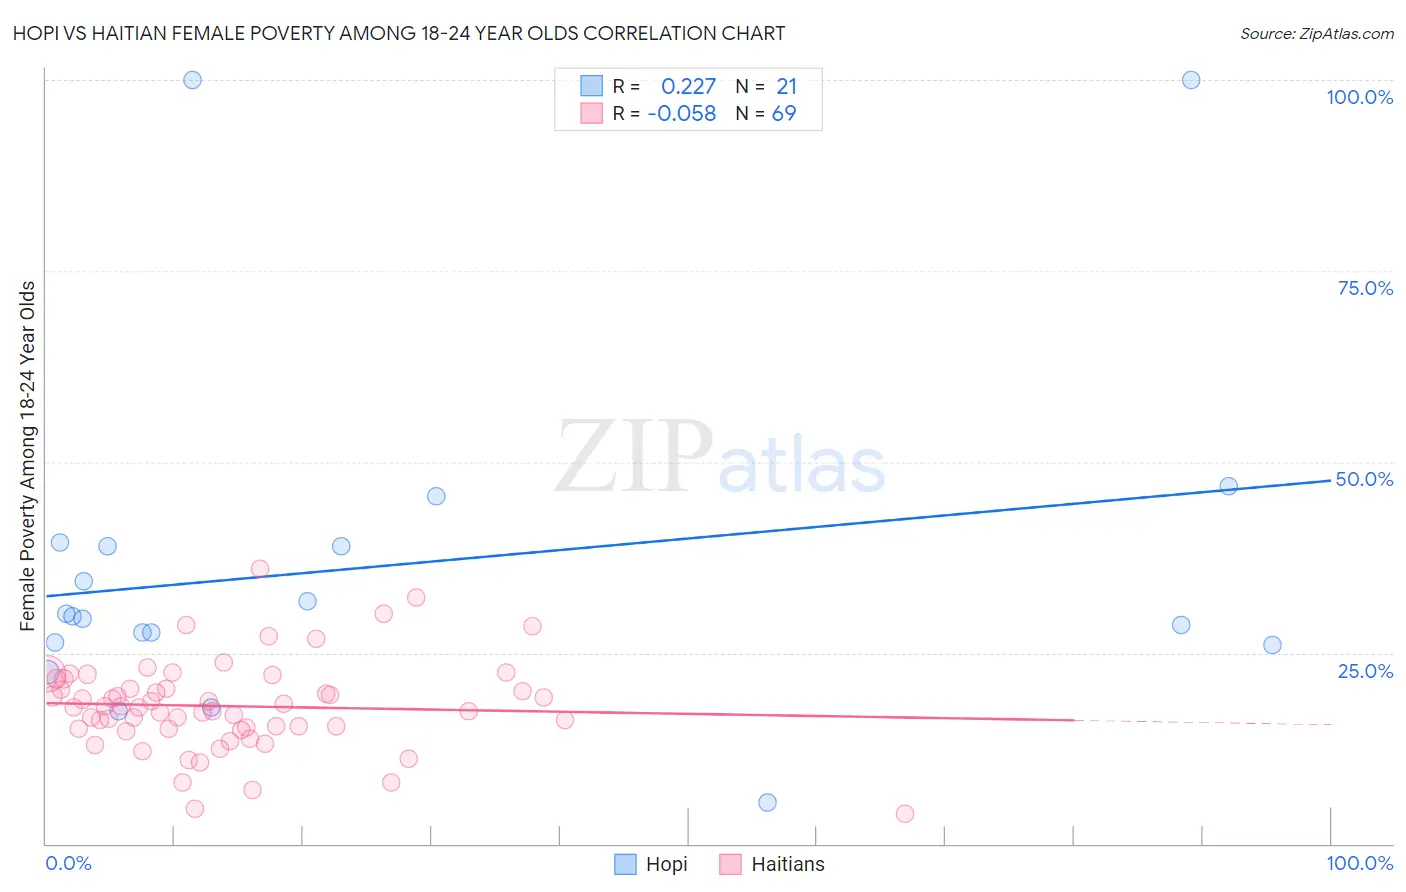
Hopi vs Haitian Female Poverty Among 18-24 Year Olds Correlation Chart
The statistical analysis conducted on geographies consisting of 74,465,838 people shows a weak positive correlation between the proportion of Hopi and poverty level among females between the ages 18 and 24 in the United States with a correlation coefficient (R) of 0.227 and weighted average of 28.2%. Similarly, the statistical analysis conducted on geographies consisting of 282,712,652 people shows a slight negative correlation between the proportion of Haitians and poverty level among females between the ages 18 and 24 in the United States with a correlation coefficient (R) of -0.058 and weighted average of 19.0%, a difference of 48.5%.
Female Poverty Among 18-24 Year Olds Correlation Summary
| Measurement | Hopi | Haitian |
| Minimum | 5.4% | 4.0% |
| Maximum | 100.0% | 36.0% |
| Range | 94.6% | 32.0% |
| Mean | 36.4% | 18.0% |
| Median | 29.7% | 17.9% |
| Interquartile 25% (IQ1) | 26.3% | 15.1% |
| Interquartile 75% (IQ3) | 39.2% | 20.9% |
| Interquartile Range (IQR) | 13.0% | 5.8% |
| Standard Deviation (Sample) | 23.2% | 5.9% |
| Standard Deviation (Population) | 22.6% | 5.9% |
Similar Demographics by Female Poverty Among 18-24 Year Olds
Demographics Similar to Hopi by Female Poverty Among 18-24 Year Olds
In terms of female poverty among 18-24 year olds, the demographic groups most similar to Hopi are Cheyenne (28.1%, a difference of 0.21%), Pima (28.4%, a difference of 0.72%), Sioux (28.6%, a difference of 1.3%), Immigrants from Yemen (27.5%, a difference of 2.4%), and Colville (29.0%, a difference of 2.9%).
| Demographics | Rating | Rank | Female Poverty Among 18-24 Year Olds |
| Chippewa | 0.0 /100 | #331 | Tragic 25.9% |
| Houma | 0.0 /100 | #332 | Tragic 26.2% |
| Apache | 0.0 /100 | #333 | Tragic 26.3% |
| Pueblo | 0.0 /100 | #334 | Tragic 26.9% |
| Yup'ik | 0.0 /100 | #335 | Tragic 27.0% |
| Immigrants | Yemen | 0.0 /100 | #336 | Tragic 27.5% |
| Cheyenne | 0.0 /100 | #337 | Tragic 28.1% |
| Hopi | 0.0 /100 | #338 | Tragic 28.2% |
| Pima | 0.0 /100 | #339 | Tragic 28.4% |
| Sioux | 0.0 /100 | #340 | Tragic 28.6% |
| Colville | 0.0 /100 | #341 | Tragic 29.0% |
| Kiowa | 0.0 /100 | #342 | Tragic 29.2% |
| Puerto Ricans | 0.0 /100 | #343 | Tragic 29.8% |
| Navajo | 0.0 /100 | #344 | Tragic 30.3% |
| Tohono O'odham | 0.0 /100 | #345 | Tragic 31.0% |
Demographics Similar to Haitians by Female Poverty Among 18-24 Year Olds
In terms of female poverty among 18-24 year olds, the demographic groups most similar to Haitians are Filipino (19.0%, a difference of 0.030%), Ukrainian (19.0%, a difference of 0.060%), Romanian (19.0%, a difference of 0.070%), Guamanian/Chamorro (19.0%, a difference of 0.13%), and Afghan (19.0%, a difference of 0.17%).
| Demographics | Rating | Rank | Female Poverty Among 18-24 Year Olds |
| Immigrants | Iraq | 99.2 /100 | #86 | Exceptional 18.9% |
| Immigrants | Jamaica | 99.2 /100 | #87 | Exceptional 18.9% |
| Croatians | 99.1 /100 | #88 | Exceptional 19.0% |
| Immigrants | Cabo Verde | 99.0 /100 | #89 | Exceptional 19.0% |
| Afghans | 99.0 /100 | #90 | Exceptional 19.0% |
| Romanians | 98.9 /100 | #91 | Exceptional 19.0% |
| Filipinos | 98.9 /100 | #92 | Exceptional 19.0% |
| Haitians | 98.9 /100 | #93 | Exceptional 19.0% |
| Ukrainians | 98.8 /100 | #94 | Exceptional 19.0% |
| Guamanians/Chamorros | 98.8 /100 | #95 | Exceptional 19.0% |
| Sierra Leoneans | 98.7 /100 | #96 | Exceptional 19.0% |
| Salvadorans | 98.4 /100 | #97 | Exceptional 19.1% |
| Immigrants | Jordan | 98.4 /100 | #98 | Exceptional 19.1% |
| Immigrants | Czechoslovakia | 98.3 /100 | #99 | Exceptional 19.1% |
| Chileans | 98.3 /100 | #100 | Exceptional 19.1% |