Honduran vs Chickasaw Child Poverty Among Boys Under 16
COMPARE
Honduran
Chickasaw
Child Poverty Among Boys Under 16
Child Poverty Among Boys Under 16 Comparison
Hondurans
Chickasaw
22.3%
CHILD POVERTY AMONG BOYS UNDER 16
0.0/ 100
METRIC RATING
323rd/ 347
METRIC RANK
19.8%
CHILD POVERTY AMONG BOYS UNDER 16
0.1/ 100
METRIC RATING
271st/ 347
METRIC RANK
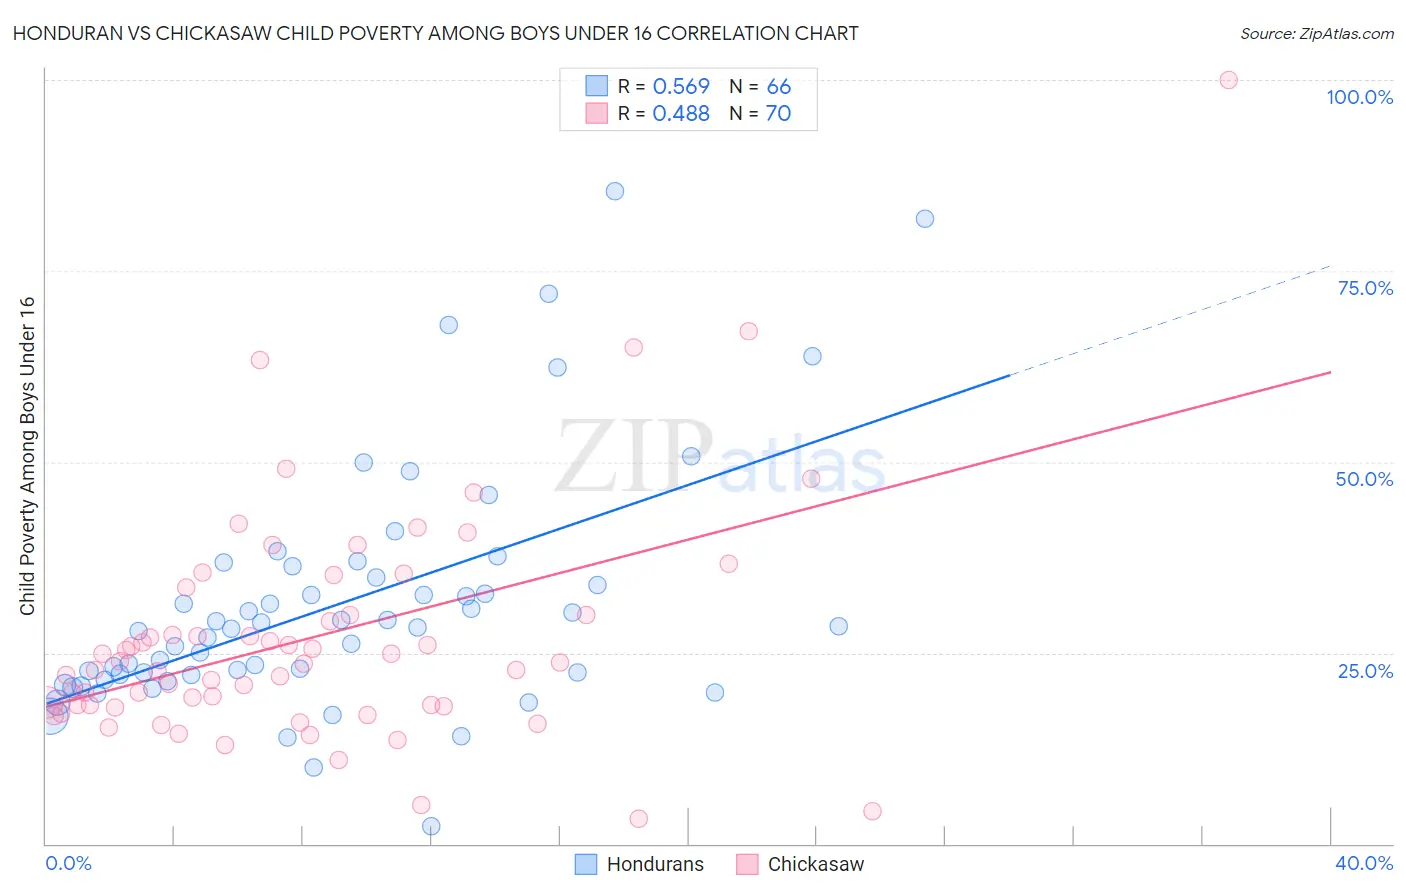
Honduran vs Chickasaw Child Poverty Among Boys Under 16 Correlation Chart
The statistical analysis conducted on geographies consisting of 354,725,879 people shows a substantial positive correlation between the proportion of Hondurans and poverty level among boys under the age of 16 in the United States with a correlation coefficient (R) of 0.569 and weighted average of 22.3%. Similarly, the statistical analysis conducted on geographies consisting of 146,816,928 people shows a moderate positive correlation between the proportion of Chickasaw and poverty level among boys under the age of 16 in the United States with a correlation coefficient (R) of 0.488 and weighted average of 19.8%, a difference of 12.7%.
Child Poverty Among Boys Under 16 Correlation Summary
| Measurement | Honduran | Chickasaw |
| Minimum | 2.3% | 3.3% |
| Maximum | 85.5% | 100.0% |
| Range | 83.1% | 96.7% |
| Mean | 31.4% | 27.0% |
| Median | 28.2% | 23.7% |
| Interquartile 25% (IQ1) | 22.2% | 18.1% |
| Interquartile 75% (IQ3) | 34.9% | 30.0% |
| Interquartile Range (IQR) | 12.7% | 11.9% |
| Standard Deviation (Sample) | 16.0% | 15.5% |
| Standard Deviation (Population) | 15.8% | 15.4% |
Similar Demographics by Child Poverty Among Boys Under 16
Demographics Similar to Hondurans by Child Poverty Among Boys Under 16
In terms of child poverty among boys under 16, the demographic groups most similar to Hondurans are Immigrants from Congo (22.4%, a difference of 0.37%), Immigrants from Dominica (22.2%, a difference of 0.53%), Cajun (22.2%, a difference of 0.56%), Central American Indian (22.5%, a difference of 0.87%), and U.S. Virgin Islander (22.0%, a difference of 1.5%).
| Demographics | Rating | Rank | Child Poverty Among Boys Under 16 |
| Menominee | 0.0 /100 | #316 | Tragic 21.7% |
| Africans | 0.0 /100 | #317 | Tragic 21.7% |
| Yakama | 0.0 /100 | #318 | Tragic 21.7% |
| Dutch West Indians | 0.0 /100 | #319 | Tragic 21.8% |
| U.S. Virgin Islanders | 0.0 /100 | #320 | Tragic 22.0% |
| Cajuns | 0.0 /100 | #321 | Tragic 22.2% |
| Immigrants | Dominica | 0.0 /100 | #322 | Tragic 22.2% |
| Hondurans | 0.0 /100 | #323 | Tragic 22.3% |
| Immigrants | Congo | 0.0 /100 | #324 | Tragic 22.4% |
| Central American Indians | 0.0 /100 | #325 | Tragic 22.5% |
| Paiute | 0.0 /100 | #326 | Tragic 22.8% |
| Immigrants | Honduras | 0.0 /100 | #327 | Tragic 22.8% |
| Pueblo | 0.0 /100 | #328 | Tragic 23.5% |
| Natives/Alaskans | 0.0 /100 | #329 | Tragic 24.0% |
| Colville | 0.0 /100 | #330 | Tragic 24.1% |
Demographics Similar to Chickasaw by Child Poverty Among Boys Under 16
In terms of child poverty among boys under 16, the demographic groups most similar to Chickasaw are Immigrants from Ecuador (19.8%, a difference of 0.22%), Belizean (19.9%, a difference of 0.36%), Cherokee (19.7%, a difference of 0.50%), Immigrants from Bangladesh (19.9%, a difference of 0.62%), and Jamaican (20.0%, a difference of 0.74%).
| Demographics | Rating | Rank | Child Poverty Among Boys Under 16 |
| Iroquois | 0.1 /100 | #264 | Tragic 19.6% |
| Guyanese | 0.1 /100 | #265 | Tragic 19.6% |
| Immigrants | El Salvador | 0.1 /100 | #266 | Tragic 19.6% |
| Vietnamese | 0.1 /100 | #267 | Tragic 19.6% |
| Spanish American Indians | 0.1 /100 | #268 | Tragic 19.6% |
| Immigrants | Cabo Verde | 0.1 /100 | #269 | Tragic 19.7% |
| Cherokee | 0.1 /100 | #270 | Tragic 19.7% |
| Chickasaw | 0.1 /100 | #271 | Tragic 19.8% |
| Immigrants | Ecuador | 0.1 /100 | #272 | Tragic 19.8% |
| Belizeans | 0.1 /100 | #273 | Tragic 19.9% |
| Immigrants | Bangladesh | 0.0 /100 | #274 | Tragic 19.9% |
| Jamaicans | 0.0 /100 | #275 | Tragic 20.0% |
| Sub-Saharan Africans | 0.0 /100 | #276 | Tragic 20.0% |
| Immigrants | Barbados | 0.0 /100 | #277 | Tragic 20.0% |
| Immigrants | West Indies | 0.0 /100 | #278 | Tragic 20.0% |