Alaskan Athabascan vs German Seniors Poverty Over the Age of 65
COMPARE
Alaskan Athabascan
German
Seniors Poverty Over the Age of 65
Seniors Poverty Over the Age of 65 Comparison
Alaskan Athabascans
Germans
10.6%
SENIORS POVERTY OVER THE AGE OF 65
79.1/ 100
METRIC RATING
146th/ 347
METRIC RANK
9.0%
SENIORS POVERTY OVER THE AGE OF 65
100.0/ 100
METRIC RATING
7th/ 347
METRIC RANK
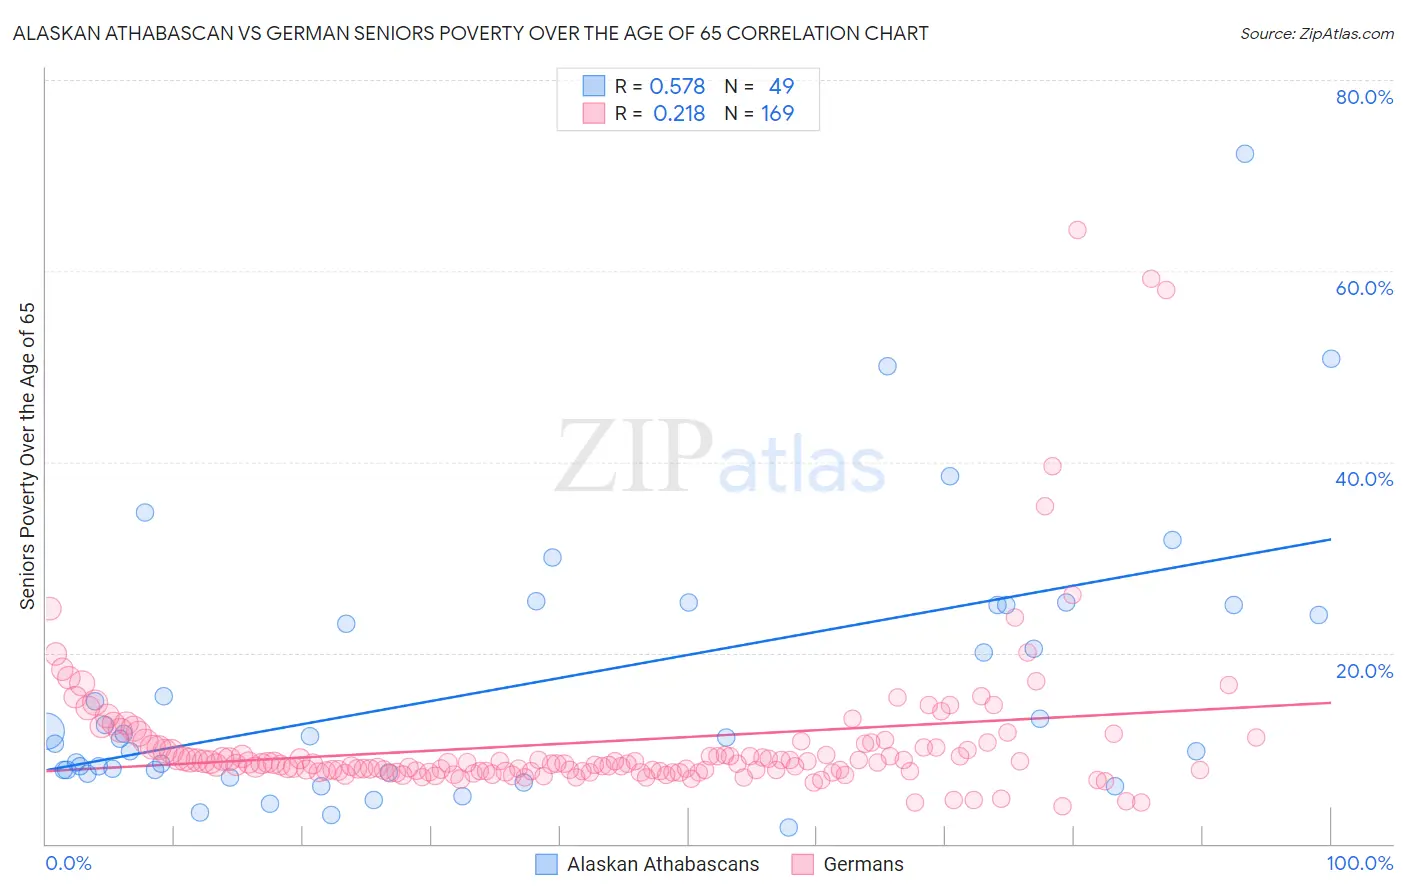
Alaskan Athabascan vs German Seniors Poverty Over the Age of 65 Correlation Chart
The statistical analysis conducted on geographies consisting of 45,753,118 people shows a substantial positive correlation between the proportion of Alaskan Athabascans and poverty level among seniors over the age of 65 in the United States with a correlation coefficient (R) of 0.578 and weighted average of 10.6%. Similarly, the statistical analysis conducted on geographies consisting of 574,200,569 people shows a weak positive correlation between the proportion of Germans and poverty level among seniors over the age of 65 in the United States with a correlation coefficient (R) of 0.218 and weighted average of 9.0%, a difference of 18.6%.
Seniors Poverty Over the Age of 65 Correlation Summary
| Measurement | Alaskan Athabascan | German |
| Minimum | 1.7% | 3.9% |
| Maximum | 72.2% | 64.3% |
| Range | 70.5% | 60.4% |
| Mean | 16.6% | 10.7% |
| Median | 11.1% | 8.4% |
| Interquartile 25% (IQ1) | 7.6% | 7.6% |
| Interquartile 75% (IQ3) | 25.0% | 10.1% |
| Interquartile Range (IQR) | 17.4% | 2.5% |
| Standard Deviation (Sample) | 14.2% | 8.2% |
| Standard Deviation (Population) | 14.0% | 8.2% |
Similar Demographics by Seniors Poverty Over the Age of 65
Demographics Similar to Alaskan Athabascans by Seniors Poverty Over the Age of 65
In terms of seniors poverty over the age of 65, the demographic groups most similar to Alaskan Athabascans are Immigrants from Greece (10.6%, a difference of 0.020%), Laotian (10.6%, a difference of 0.10%), American (10.6%, a difference of 0.14%), Immigrants from Cameroon (10.6%, a difference of 0.15%), and Iraqi (10.6%, a difference of 0.22%).
| Demographics | Rating | Rank | Seniors Poverty Over the Age of 65 |
| Portuguese | 84.1 /100 | #139 | Excellent 10.5% |
| Immigrants | Kenya | 83.4 /100 | #140 | Excellent 10.5% |
| Immigrants | Europe | 83.3 /100 | #141 | Excellent 10.5% |
| Osage | 82.8 /100 | #142 | Excellent 10.6% |
| Immigrants | Asia | 80.8 /100 | #143 | Excellent 10.6% |
| Iraqis | 80.7 /100 | #144 | Excellent 10.6% |
| Laotians | 79.9 /100 | #145 | Good 10.6% |
| Alaskan Athabascans | 79.1 /100 | #146 | Good 10.6% |
| Immigrants | Greece | 79.0 /100 | #147 | Good 10.6% |
| Americans | 78.1 /100 | #148 | Good 10.6% |
| Immigrants | Cameroon | 78.1 /100 | #149 | Good 10.6% |
| Immigrants | Switzerland | 77.3 /100 | #150 | Good 10.6% |
| Spanish | 76.8 /100 | #151 | Good 10.6% |
| Immigrants | Egypt | 76.5 /100 | #152 | Good 10.6% |
| Fijians | 75.6 /100 | #153 | Good 10.7% |
Demographics Similar to Germans by Seniors Poverty Over the Age of 65
In terms of seniors poverty over the age of 65, the demographic groups most similar to Germans are Czech (9.0%, a difference of 0.53%), English (9.1%, a difference of 1.2%), Lithuanian (9.1%, a difference of 1.3%), Danish (8.8%, a difference of 1.6%), and Maltese (9.1%, a difference of 1.7%).
| Demographics | Rating | Rank | Seniors Poverty Over the Age of 65 |
| Chinese | 100.0 /100 | #1 | Exceptional 8.3% |
| Tlingit-Haida | 100.0 /100 | #2 | Exceptional 8.3% |
| Norwegians | 100.0 /100 | #3 | Exceptional 8.7% |
| Swedes | 100.0 /100 | #4 | Exceptional 8.7% |
| Immigrants | India | 100.0 /100 | #5 | Exceptional 8.8% |
| Danes | 100.0 /100 | #6 | Exceptional 8.8% |
| Germans | 100.0 /100 | #7 | Exceptional 9.0% |
| Czechs | 100.0 /100 | #8 | Exceptional 9.0% |
| English | 100.0 /100 | #9 | Exceptional 9.1% |
| Lithuanians | 100.0 /100 | #10 | Exceptional 9.1% |
| Maltese | 99.9 /100 | #11 | Exceptional 9.1% |
| Scandinavians | 99.9 /100 | #12 | Exceptional 9.1% |
| Croatians | 99.9 /100 | #13 | Exceptional 9.1% |
| Poles | 99.9 /100 | #14 | Exceptional 9.1% |
| Dutch | 99.9 /100 | #15 | Exceptional 9.1% |