Immigrants from Serbia vs German Seniors Poverty Over the Age of 65
COMPARE
Immigrants from Serbia
German
Seniors Poverty Over the Age of 65
Seniors Poverty Over the Age of 65 Comparison
Immigrants from Serbia
Germans
10.5%
SENIORS POVERTY OVER THE AGE OF 65
86.4/ 100
METRIC RATING
136th/ 347
METRIC RANK
9.0%
SENIORS POVERTY OVER THE AGE OF 65
100.0/ 100
METRIC RATING
7th/ 347
METRIC RANK
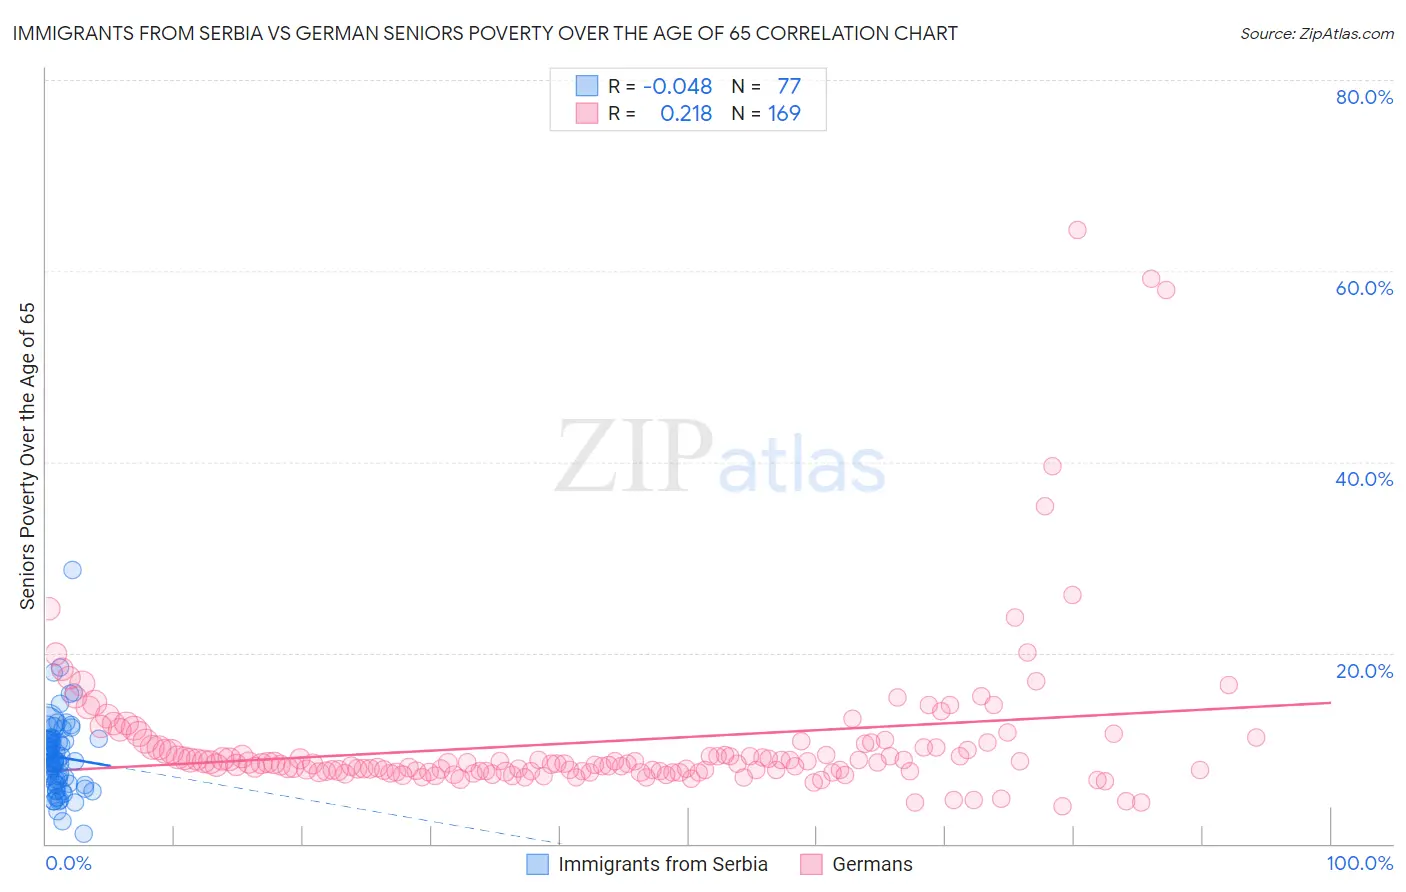
Immigrants from Serbia vs German Seniors Poverty Over the Age of 65 Correlation Chart
The statistical analysis conducted on geographies consisting of 131,575,846 people shows no correlation between the proportion of Immigrants from Serbia and poverty level among seniors over the age of 65 in the United States with a correlation coefficient (R) of -0.048 and weighted average of 10.5%. Similarly, the statistical analysis conducted on geographies consisting of 574,200,569 people shows a weak positive correlation between the proportion of Germans and poverty level among seniors over the age of 65 in the United States with a correlation coefficient (R) of 0.218 and weighted average of 9.0%, a difference of 17.2%.
Seniors Poverty Over the Age of 65 Correlation Summary
| Measurement | Immigrants from Serbia | German |
| Minimum | 1.0% | 3.9% |
| Maximum | 28.7% | 64.3% |
| Range | 27.7% | 60.4% |
| Mean | 9.1% | 10.7% |
| Median | 8.7% | 8.4% |
| Interquartile 25% (IQ1) | 6.3% | 7.6% |
| Interquartile 75% (IQ3) | 10.9% | 10.1% |
| Interquartile Range (IQR) | 4.7% | 2.5% |
| Standard Deviation (Sample) | 4.1% | 8.2% |
| Standard Deviation (Population) | 4.0% | 8.2% |
Similar Demographics by Seniors Poverty Over the Age of 65
Demographics Similar to Immigrants from Serbia by Seniors Poverty Over the Age of 65
In terms of seniors poverty over the age of 65, the demographic groups most similar to Immigrants from Serbia are Immigrants from Norway (10.5%, a difference of 0.010%), Sierra Leonean (10.5%, a difference of 0.070%), Guamanian/Chamorro (10.5%, a difference of 0.23%), Immigrants from Australia (10.5%, a difference of 0.26%), and Immigrants from Turkey (10.5%, a difference of 0.27%).
| Demographics | Rating | Rank | Seniors Poverty Over the Age of 65 |
| Immigrants | Iran | 88.4 /100 | #129 | Excellent 10.4% |
| Immigrants | Oceania | 88.4 /100 | #130 | Excellent 10.4% |
| Egyptians | 87.8 /100 | #131 | Excellent 10.5% |
| Immigrants | Turkey | 87.7 /100 | #132 | Excellent 10.5% |
| Guamanians/Chamorros | 87.5 /100 | #133 | Excellent 10.5% |
| Sierra Leoneans | 86.8 /100 | #134 | Excellent 10.5% |
| Immigrants | Norway | 86.5 /100 | #135 | Excellent 10.5% |
| Immigrants | Serbia | 86.4 /100 | #136 | Excellent 10.5% |
| Immigrants | Australia | 85.1 /100 | #137 | Excellent 10.5% |
| Immigrants | Latvia | 84.7 /100 | #138 | Excellent 10.5% |
| Portuguese | 84.1 /100 | #139 | Excellent 10.5% |
| Immigrants | Kenya | 83.4 /100 | #140 | Excellent 10.5% |
| Immigrants | Europe | 83.3 /100 | #141 | Excellent 10.5% |
| Osage | 82.8 /100 | #142 | Excellent 10.6% |
| Immigrants | Asia | 80.8 /100 | #143 | Excellent 10.6% |
Demographics Similar to Germans by Seniors Poverty Over the Age of 65
In terms of seniors poverty over the age of 65, the demographic groups most similar to Germans are Czech (9.0%, a difference of 0.53%), English (9.1%, a difference of 1.2%), Lithuanian (9.1%, a difference of 1.3%), Danish (8.8%, a difference of 1.6%), and Maltese (9.1%, a difference of 1.7%).
| Demographics | Rating | Rank | Seniors Poverty Over the Age of 65 |
| Chinese | 100.0 /100 | #1 | Exceptional 8.3% |
| Tlingit-Haida | 100.0 /100 | #2 | Exceptional 8.3% |
| Norwegians | 100.0 /100 | #3 | Exceptional 8.7% |
| Swedes | 100.0 /100 | #4 | Exceptional 8.7% |
| Immigrants | India | 100.0 /100 | #5 | Exceptional 8.8% |
| Danes | 100.0 /100 | #6 | Exceptional 8.8% |
| Germans | 100.0 /100 | #7 | Exceptional 9.0% |
| Czechs | 100.0 /100 | #8 | Exceptional 9.0% |
| English | 100.0 /100 | #9 | Exceptional 9.1% |
| Lithuanians | 100.0 /100 | #10 | Exceptional 9.1% |
| Maltese | 99.9 /100 | #11 | Exceptional 9.1% |
| Scandinavians | 99.9 /100 | #12 | Exceptional 9.1% |
| Croatians | 99.9 /100 | #13 | Exceptional 9.1% |
| Poles | 99.9 /100 | #14 | Exceptional 9.1% |
| Dutch | 99.9 /100 | #15 | Exceptional 9.1% |