Dutch vs Immigrants from Malaysia Male Poverty
COMPARE
Dutch
Immigrants from Malaysia
Male Poverty
Male Poverty Comparison
Dutch
Immigrants from Malaysia
10.2%
MALE POVERTY
96.9/ 100
METRIC RATING
76th/ 347
METRIC RANK
11.0%
MALE POVERTY
64.7/ 100
METRIC RATING
155th/ 347
METRIC RANK
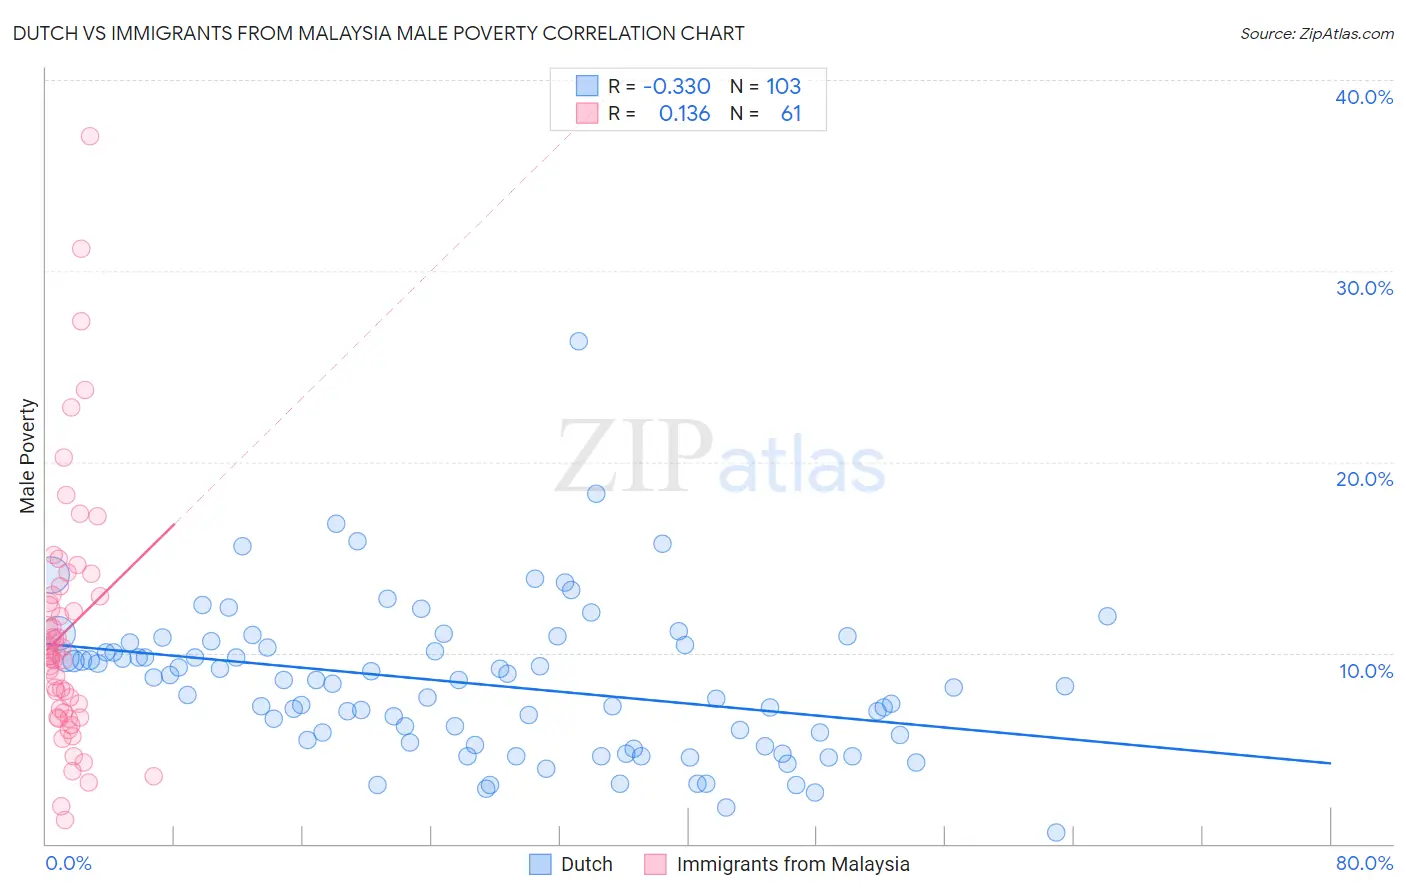
Dutch vs Immigrants from Malaysia Male Poverty Correlation Chart
The statistical analysis conducted on geographies consisting of 553,017,798 people shows a mild negative correlation between the proportion of Dutch and poverty level among males in the United States with a correlation coefficient (R) of -0.330 and weighted average of 10.2%. Similarly, the statistical analysis conducted on geographies consisting of 197,921,131 people shows a poor positive correlation between the proportion of Immigrants from Malaysia and poverty level among males in the United States with a correlation coefficient (R) of 0.136 and weighted average of 11.0%, a difference of 7.6%.
Male Poverty Correlation Summary
| Measurement | Dutch | Immigrants from Malaysia |
| Minimum | 0.58% | 1.3% |
| Maximum | 26.3% | 37.1% |
| Range | 25.7% | 35.8% |
| Mean | 8.4% | 11.2% |
| Median | 8.4% | 9.9% |
| Interquartile 25% (IQ1) | 5.3% | 6.8% |
| Interquartile 75% (IQ3) | 10.4% | 13.2% |
| Interquartile Range (IQR) | 5.1% | 6.5% |
| Standard Deviation (Sample) | 3.9% | 6.7% |
| Standard Deviation (Population) | 3.9% | 6.6% |
Similar Demographics by Male Poverty
Demographics Similar to Dutch by Male Poverty
In terms of male poverty, the demographic groups most similar to Dutch are Immigrants from Eastern Europe (10.2%, a difference of 0.010%), Carpatho Rusyn (10.2%, a difference of 0.010%), Immigrants from Belgium (10.3%, a difference of 0.030%), Irish (10.3%, a difference of 0.050%), and Immigrants from Asia (10.2%, a difference of 0.080%).
| Demographics | Rating | Rank | Male Poverty |
| Immigrants | Australia | 97.1 /100 | #69 | Exceptional 10.2% |
| Paraguayans | 97.1 /100 | #70 | Exceptional 10.2% |
| Europeans | 97.1 /100 | #71 | Exceptional 10.2% |
| Immigrants | Canada | 97.1 /100 | #72 | Exceptional 10.2% |
| Immigrants | Asia | 97.0 /100 | #73 | Exceptional 10.2% |
| Immigrants | Eastern Europe | 96.9 /100 | #74 | Exceptional 10.2% |
| Carpatho Rusyns | 96.9 /100 | #75 | Exceptional 10.2% |
| Dutch | 96.9 /100 | #76 | Exceptional 10.2% |
| Immigrants | Belgium | 96.8 /100 | #77 | Exceptional 10.3% |
| Irish | 96.8 /100 | #78 | Exceptional 10.3% |
| Immigrants | North America | 96.5 /100 | #79 | Exceptional 10.3% |
| English | 96.4 /100 | #80 | Exceptional 10.3% |
| Belgians | 95.9 /100 | #81 | Exceptional 10.3% |
| Egyptians | 95.9 /100 | #82 | Exceptional 10.3% |
| Immigrants | Sweden | 95.7 /100 | #83 | Exceptional 10.3% |
Demographics Similar to Immigrants from Malaysia by Male Poverty
In terms of male poverty, the demographic groups most similar to Immigrants from Malaysia are Immigrants from Kazakhstan (11.0%, a difference of 0.010%), Immigrants from Bosnia and Herzegovina (11.0%, a difference of 0.050%), Costa Rican (11.0%, a difference of 0.090%), Scotch-Irish (11.0%, a difference of 0.11%), and Colombian (11.0%, a difference of 0.19%).
| Demographics | Rating | Rank | Male Poverty |
| Armenians | 68.0 /100 | #148 | Good 11.0% |
| Immigrants | Venezuela | 67.9 /100 | #149 | Good 11.0% |
| Guamanians/Chamorros | 67.6 /100 | #150 | Good 11.0% |
| Venezuelans | 67.4 /100 | #151 | Good 11.0% |
| Immigrants | Nepal | 67.3 /100 | #152 | Good 11.0% |
| Immigrants | Bosnia and Herzegovina | 65.2 /100 | #153 | Good 11.0% |
| Immigrants | Kazakhstan | 64.8 /100 | #154 | Good 11.0% |
| Immigrants | Malaysia | 64.7 /100 | #155 | Good 11.0% |
| Costa Ricans | 63.9 /100 | #156 | Good 11.0% |
| Scotch-Irish | 63.7 /100 | #157 | Good 11.0% |
| Colombians | 63.0 /100 | #158 | Good 11.0% |
| Taiwanese | 62.7 /100 | #159 | Good 11.0% |
| Soviet Union | 60.3 /100 | #160 | Good 11.1% |
| Immigrants | Northern Africa | 59.7 /100 | #161 | Average 11.1% |
| Immigrants | Chile | 57.4 /100 | #162 | Average 11.1% |