Hawaiian vs Scottish Female Poverty Among 18-24 Year Olds
COMPARE
Hawaiian
Scottish
Female Poverty Among 18-24 Year Olds
Female Poverty Among 18-24 Year Olds Comparison
Hawaiians
Scottish
18.7%
FEMALE POVERTY AMONG 18-24 YEAR OLDS
99.6/ 100
METRIC RATING
74th/ 347
METRIC RANK
20.9%
FEMALE POVERTY AMONG 18-24 YEAR OLDS
4.5/ 100
METRIC RATING
237th/ 347
METRIC RANK
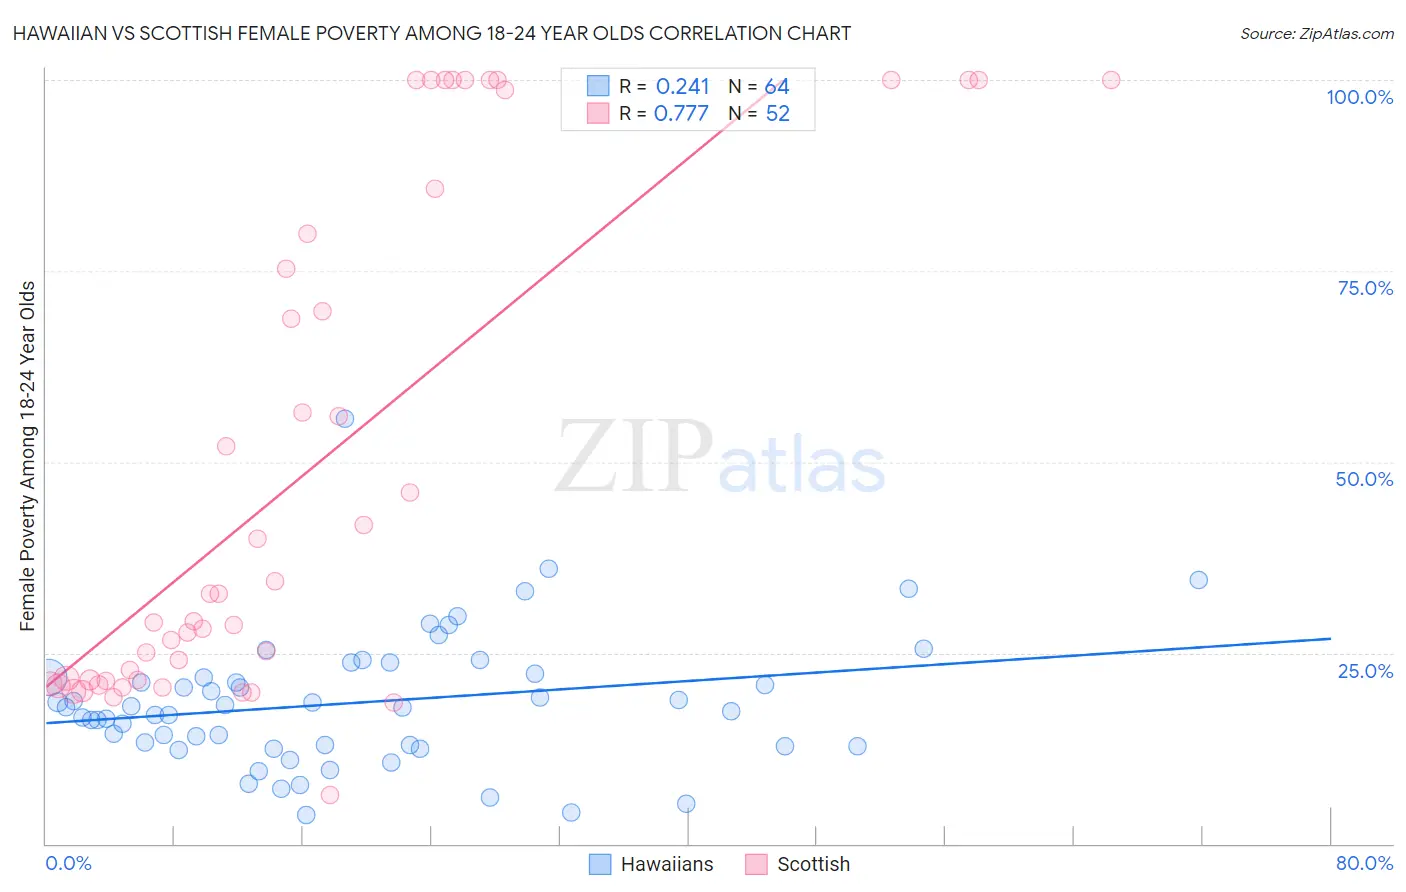
Hawaiian vs Scottish Female Poverty Among 18-24 Year Olds Correlation Chart
The statistical analysis conducted on geographies consisting of 322,443,370 people shows a weak positive correlation between the proportion of Hawaiians and poverty level among females between the ages 18 and 24 in the United States with a correlation coefficient (R) of 0.241 and weighted average of 18.7%. Similarly, the statistical analysis conducted on geographies consisting of 532,782,513 people shows a strong positive correlation between the proportion of Scottish and poverty level among females between the ages 18 and 24 in the United States with a correlation coefficient (R) of 0.777 and weighted average of 20.9%, a difference of 11.4%.
Female Poverty Among 18-24 Year Olds Correlation Summary
| Measurement | Hawaiian | Scottish |
| Minimum | 3.8% | 6.3% |
| Maximum | 55.6% | 100.0% |
| Range | 51.8% | 93.7% |
| Mean | 18.5% | 49.0% |
| Median | 17.9% | 30.9% |
| Interquartile 25% (IQ1) | 12.8% | 21.4% |
| Interquartile 75% (IQ3) | 22.0% | 82.8% |
| Interquartile Range (IQR) | 9.3% | 61.4% |
| Standard Deviation (Sample) | 8.8% | 32.8% |
| Standard Deviation (Population) | 8.7% | 32.5% |
Similar Demographics by Female Poverty Among 18-24 Year Olds
Demographics Similar to Hawaiians by Female Poverty Among 18-24 Year Olds
In terms of female poverty among 18-24 year olds, the demographic groups most similar to Hawaiians are Lithuanian (18.7%, a difference of 0.19%), Polish (18.8%, a difference of 0.21%), Armenian (18.7%, a difference of 0.22%), Immigrants from Haiti (18.7%, a difference of 0.24%), and Immigrants from Cambodia (18.8%, a difference of 0.29%).
| Demographics | Rating | Rank | Female Poverty Among 18-24 Year Olds |
| Immigrants | Korea | 99.8 /100 | #67 | Exceptional 18.6% |
| Brazilians | 99.8 /100 | #68 | Exceptional 18.6% |
| Immigrants | Bulgaria | 99.7 /100 | #69 | Exceptional 18.6% |
| Immigrants | Costa Rica | 99.7 /100 | #70 | Exceptional 18.7% |
| Immigrants | Haiti | 99.7 /100 | #71 | Exceptional 18.7% |
| Armenians | 99.7 /100 | #72 | Exceptional 18.7% |
| Lithuanians | 99.7 /100 | #73 | Exceptional 18.7% |
| Hawaiians | 99.6 /100 | #74 | Exceptional 18.7% |
| Poles | 99.6 /100 | #75 | Exceptional 18.8% |
| Immigrants | Cambodia | 99.5 /100 | #76 | Exceptional 18.8% |
| Costa Ricans | 99.5 /100 | #77 | Exceptional 18.8% |
| Immigrants | Europe | 99.5 /100 | #78 | Exceptional 18.8% |
| Uruguayans | 99.5 /100 | #79 | Exceptional 18.8% |
| Palestinians | 99.5 /100 | #80 | Exceptional 18.8% |
| Japanese | 99.5 /100 | #81 | Exceptional 18.8% |
Demographics Similar to Scottish by Female Poverty Among 18-24 Year Olds
In terms of female poverty among 18-24 year olds, the demographic groups most similar to Scottish are Immigrants from Singapore (20.9%, a difference of 0.040%), Immigrants from Guatemala (20.9%, a difference of 0.050%), Luxembourger (20.9%, a difference of 0.070%), Immigrants from Eritrea (20.9%, a difference of 0.090%), and Okinawan (20.8%, a difference of 0.10%).
| Demographics | Rating | Rank | Female Poverty Among 18-24 Year Olds |
| Whites/Caucasians | 6.1 /100 | #230 | Tragic 20.8% |
| Immigrants | St. Vincent and the Grenadines | 6.0 /100 | #231 | Tragic 20.8% |
| Finns | 6.0 /100 | #232 | Tragic 20.8% |
| Immigrants | Denmark | 5.8 /100 | #233 | Tragic 20.8% |
| Welsh | 5.4 /100 | #234 | Tragic 20.8% |
| Immigrants | Uganda | 5.1 /100 | #235 | Tragic 20.8% |
| Okinawans | 4.9 /100 | #236 | Tragic 20.8% |
| Scottish | 4.5 /100 | #237 | Tragic 20.9% |
| Immigrants | Singapore | 4.4 /100 | #238 | Tragic 20.9% |
| Immigrants | Guatemala | 4.3 /100 | #239 | Tragic 20.9% |
| Luxembourgers | 4.2 /100 | #240 | Tragic 20.9% |
| Immigrants | Eritrea | 4.2 /100 | #241 | Tragic 20.9% |
| Israelis | 4.1 /100 | #242 | Tragic 20.9% |
| Marshallese | 3.4 /100 | #243 | Tragic 20.9% |
| Immigrants | Thailand | 3.4 /100 | #244 | Tragic 20.9% |