Swiss vs Scottish Female Poverty Among 18-24 Year Olds
COMPARE
Swiss
Scottish
Female Poverty Among 18-24 Year Olds
Female Poverty Among 18-24 Year Olds Comparison
Swiss
Scottish
20.2%
FEMALE POVERTY AMONG 18-24 YEAR OLDS
44.0/ 100
METRIC RATING
178th/ 347
METRIC RANK
20.9%
FEMALE POVERTY AMONG 18-24 YEAR OLDS
4.5/ 100
METRIC RATING
237th/ 347
METRIC RANK
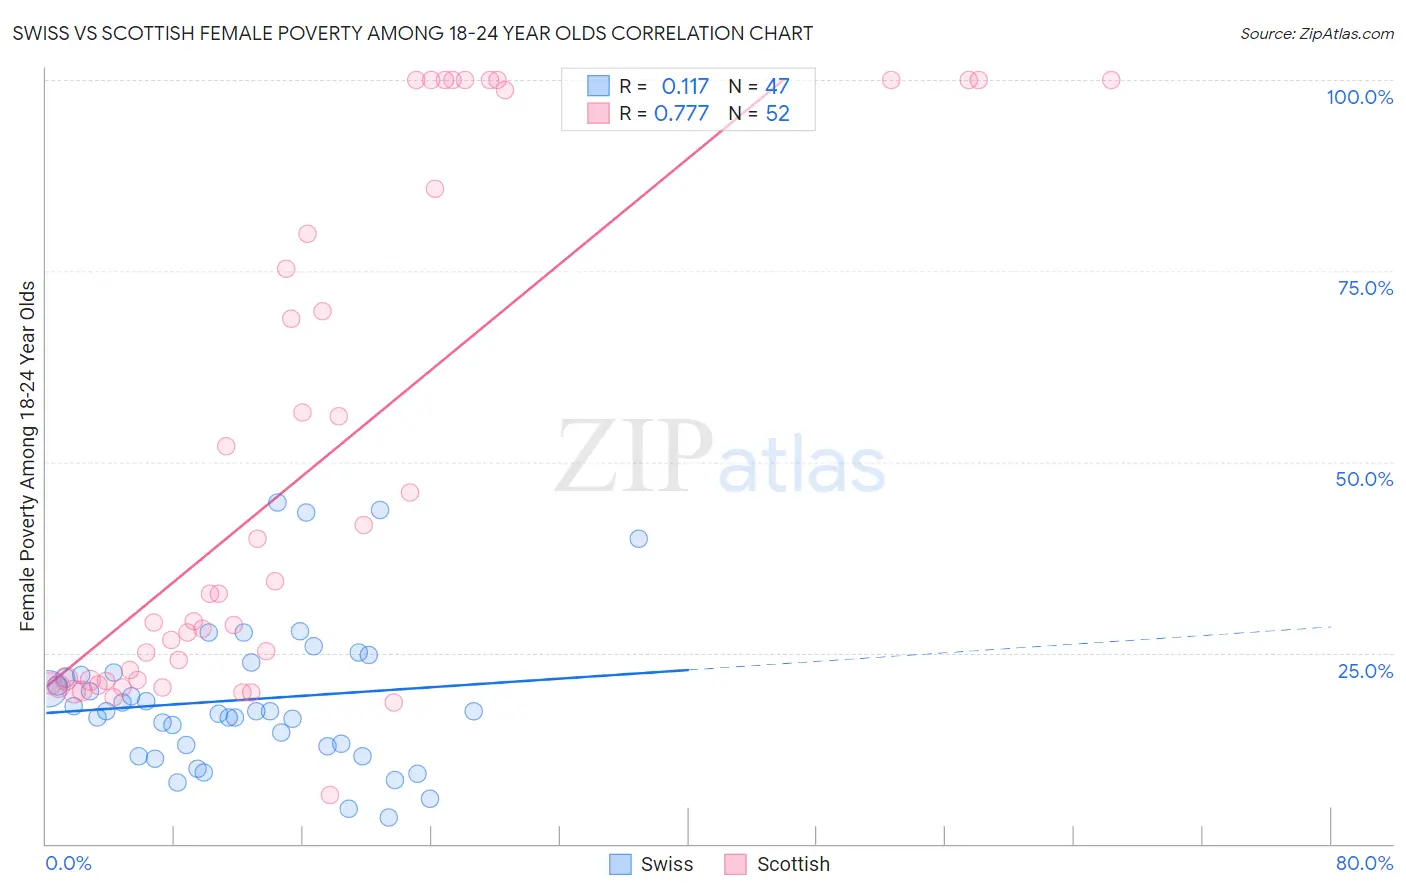
Swiss vs Scottish Female Poverty Among 18-24 Year Olds Correlation Chart
The statistical analysis conducted on geographies consisting of 446,334,807 people shows a poor positive correlation between the proportion of Swiss and poverty level among females between the ages 18 and 24 in the United States with a correlation coefficient (R) of 0.117 and weighted average of 20.2%. Similarly, the statistical analysis conducted on geographies consisting of 532,782,513 people shows a strong positive correlation between the proportion of Scottish and poverty level among females between the ages 18 and 24 in the United States with a correlation coefficient (R) of 0.777 and weighted average of 20.9%, a difference of 3.4%.
Female Poverty Among 18-24 Year Olds Correlation Summary
| Measurement | Swiss | Scottish |
| Minimum | 3.4% | 6.3% |
| Maximum | 44.7% | 100.0% |
| Range | 41.3% | 93.7% |
| Mean | 18.8% | 49.0% |
| Median | 17.4% | 30.9% |
| Interquartile 25% (IQ1) | 12.8% | 21.4% |
| Interquartile 75% (IQ3) | 22.3% | 82.8% |
| Interquartile Range (IQR) | 9.6% | 61.4% |
| Standard Deviation (Sample) | 9.6% | 32.8% |
| Standard Deviation (Population) | 9.4% | 32.5% |
Similar Demographics by Female Poverty Among 18-24 Year Olds
Demographics Similar to Swiss by Female Poverty Among 18-24 Year Olds
In terms of female poverty among 18-24 year olds, the demographic groups most similar to Swiss are Immigrants from Kazakhstan (20.2%, a difference of 0.010%), Ethiopian (20.2%, a difference of 0.010%), Iraqi (20.2%, a difference of 0.030%), Kenyan (20.2%, a difference of 0.040%), and Immigrants from China (20.2%, a difference of 0.050%).
| Demographics | Rating | Rank | Female Poverty Among 18-24 Year Olds |
| Immigrants | Nigeria | 54.3 /100 | #171 | Average 20.1% |
| Belizeans | 52.0 /100 | #172 | Average 20.1% |
| Irish | 50.0 /100 | #173 | Average 20.1% |
| Swedes | 50.0 /100 | #174 | Average 20.1% |
| South American Indians | 48.4 /100 | #175 | Average 20.1% |
| Kenyans | 44.9 /100 | #176 | Average 20.2% |
| Immigrants | Kazakhstan | 44.2 /100 | #177 | Average 20.2% |
| Swiss | 44.0 /100 | #178 | Average 20.2% |
| Ethiopians | 43.8 /100 | #179 | Average 20.2% |
| Iraqis | 43.3 /100 | #180 | Average 20.2% |
| Immigrants | China | 43.0 /100 | #181 | Average 20.2% |
| Immigrants | Barbados | 42.8 /100 | #182 | Average 20.2% |
| Lebanese | 40.6 /100 | #183 | Average 20.2% |
| Immigrants | Central America | 39.9 /100 | #184 | Fair 20.2% |
| Nepalese | 39.7 /100 | #185 | Fair 20.2% |
Demographics Similar to Scottish by Female Poverty Among 18-24 Year Olds
In terms of female poverty among 18-24 year olds, the demographic groups most similar to Scottish are Immigrants from Singapore (20.9%, a difference of 0.040%), Immigrants from Guatemala (20.9%, a difference of 0.050%), Luxembourger (20.9%, a difference of 0.070%), Immigrants from Eritrea (20.9%, a difference of 0.090%), and Okinawan (20.8%, a difference of 0.10%).
| Demographics | Rating | Rank | Female Poverty Among 18-24 Year Olds |
| Whites/Caucasians | 6.1 /100 | #230 | Tragic 20.8% |
| Immigrants | St. Vincent and the Grenadines | 6.0 /100 | #231 | Tragic 20.8% |
| Finns | 6.0 /100 | #232 | Tragic 20.8% |
| Immigrants | Denmark | 5.8 /100 | #233 | Tragic 20.8% |
| Welsh | 5.4 /100 | #234 | Tragic 20.8% |
| Immigrants | Uganda | 5.1 /100 | #235 | Tragic 20.8% |
| Okinawans | 4.9 /100 | #236 | Tragic 20.8% |
| Scottish | 4.5 /100 | #237 | Tragic 20.9% |
| Immigrants | Singapore | 4.4 /100 | #238 | Tragic 20.9% |
| Immigrants | Guatemala | 4.3 /100 | #239 | Tragic 20.9% |
| Luxembourgers | 4.2 /100 | #240 | Tragic 20.9% |
| Immigrants | Eritrea | 4.2 /100 | #241 | Tragic 20.9% |
| Israelis | 4.1 /100 | #242 | Tragic 20.9% |
| Marshallese | 3.4 /100 | #243 | Tragic 20.9% |
| Immigrants | Thailand | 3.4 /100 | #244 | Tragic 20.9% |