Immigrants from Spain vs Scottish Female Poverty Among 18-24 Year Olds
COMPARE
Immigrants from Spain
Scottish
Female Poverty Among 18-24 Year Olds
Female Poverty Among 18-24 Year Olds Comparison
Immigrants from Spain
Scottish
20.4%
FEMALE POVERTY AMONG 18-24 YEAR OLDS
20.7/ 100
METRIC RATING
198th/ 347
METRIC RANK
20.9%
FEMALE POVERTY AMONG 18-24 YEAR OLDS
4.5/ 100
METRIC RATING
237th/ 347
METRIC RANK
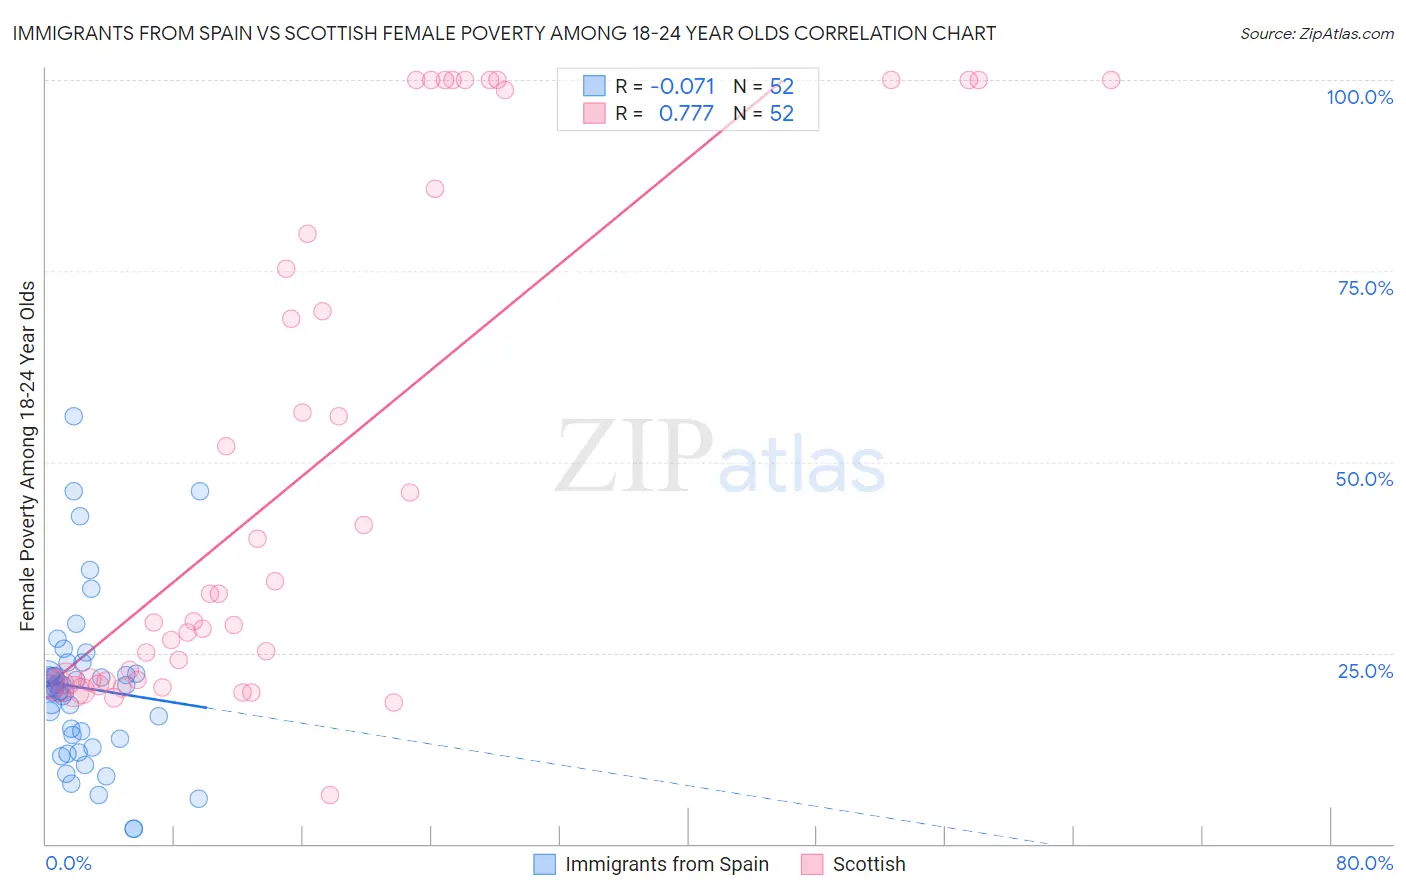
Immigrants from Spain vs Scottish Female Poverty Among 18-24 Year Olds Correlation Chart
The statistical analysis conducted on geographies consisting of 236,171,622 people shows a slight negative correlation between the proportion of Immigrants from Spain and poverty level among females between the ages 18 and 24 in the United States with a correlation coefficient (R) of -0.071 and weighted average of 20.4%. Similarly, the statistical analysis conducted on geographies consisting of 532,782,513 people shows a strong positive correlation between the proportion of Scottish and poverty level among females between the ages 18 and 24 in the United States with a correlation coefficient (R) of 0.777 and weighted average of 20.9%, a difference of 2.1%.
Female Poverty Among 18-24 Year Olds Correlation Summary
| Measurement | Immigrants from Spain | Scottish |
| Minimum | 2.0% | 6.3% |
| Maximum | 55.9% | 100.0% |
| Range | 53.9% | 93.7% |
| Mean | 20.4% | 49.0% |
| Median | 20.4% | 30.9% |
| Interquartile 25% (IQ1) | 14.0% | 21.4% |
| Interquartile 75% (IQ3) | 22.2% | 82.8% |
| Interquartile Range (IQR) | 8.1% | 61.4% |
| Standard Deviation (Sample) | 10.6% | 32.8% |
| Standard Deviation (Population) | 10.5% | 32.5% |
Similar Demographics by Female Poverty Among 18-24 Year Olds
Demographics Similar to Immigrants from Spain by Female Poverty Among 18-24 Year Olds
In terms of female poverty among 18-24 year olds, the demographic groups most similar to Immigrants from Spain are German (20.4%, a difference of 0.010%), Zimbabwean (20.4%, a difference of 0.020%), European (20.4%, a difference of 0.060%), Czech (20.4%, a difference of 0.12%), and Immigrants from Latvia (20.4%, a difference of 0.16%).
| Demographics | Rating | Rank | Female Poverty Among 18-24 Year Olds |
| Moroccans | 25.8 /100 | #191 | Fair 20.4% |
| Immigrants | Israel | 24.4 /100 | #192 | Fair 20.4% |
| Nigerians | 23.4 /100 | #193 | Fair 20.4% |
| Mexican American Indians | 23.2 /100 | #194 | Fair 20.4% |
| Immigrants | Latvia | 23.0 /100 | #195 | Fair 20.4% |
| Czechs | 22.3 /100 | #196 | Fair 20.4% |
| Zimbabweans | 21.0 /100 | #197 | Fair 20.4% |
| Immigrants | Spain | 20.7 /100 | #198 | Fair 20.4% |
| Germans | 20.6 /100 | #199 | Fair 20.4% |
| Europeans | 19.9 /100 | #200 | Poor 20.4% |
| Mexicans | 18.3 /100 | #201 | Poor 20.5% |
| Immigrants | Turkey | 17.7 /100 | #202 | Poor 20.5% |
| Immigrants | Malaysia | 17.2 /100 | #203 | Poor 20.5% |
| Immigrants | Netherlands | 17.0 /100 | #204 | Poor 20.5% |
| English | 16.7 /100 | #205 | Poor 20.5% |
Demographics Similar to Scottish by Female Poverty Among 18-24 Year Olds
In terms of female poverty among 18-24 year olds, the demographic groups most similar to Scottish are Immigrants from Singapore (20.9%, a difference of 0.040%), Immigrants from Guatemala (20.9%, a difference of 0.050%), Luxembourger (20.9%, a difference of 0.070%), Immigrants from Eritrea (20.9%, a difference of 0.090%), and Okinawan (20.8%, a difference of 0.10%).
| Demographics | Rating | Rank | Female Poverty Among 18-24 Year Olds |
| Whites/Caucasians | 6.1 /100 | #230 | Tragic 20.8% |
| Immigrants | St. Vincent and the Grenadines | 6.0 /100 | #231 | Tragic 20.8% |
| Finns | 6.0 /100 | #232 | Tragic 20.8% |
| Immigrants | Denmark | 5.8 /100 | #233 | Tragic 20.8% |
| Welsh | 5.4 /100 | #234 | Tragic 20.8% |
| Immigrants | Uganda | 5.1 /100 | #235 | Tragic 20.8% |
| Okinawans | 4.9 /100 | #236 | Tragic 20.8% |
| Scottish | 4.5 /100 | #237 | Tragic 20.9% |
| Immigrants | Singapore | 4.4 /100 | #238 | Tragic 20.9% |
| Immigrants | Guatemala | 4.3 /100 | #239 | Tragic 20.9% |
| Luxembourgers | 4.2 /100 | #240 | Tragic 20.9% |
| Immigrants | Eritrea | 4.2 /100 | #241 | Tragic 20.9% |
| Israelis | 4.1 /100 | #242 | Tragic 20.9% |
| Marshallese | 3.4 /100 | #243 | Tragic 20.9% |
| Immigrants | Thailand | 3.4 /100 | #244 | Tragic 20.9% |