Hawaiian vs Nigerian Female Poverty Among 18-24 Year Olds
COMPARE
Hawaiian
Nigerian
Female Poverty Among 18-24 Year Olds
Female Poverty Among 18-24 Year Olds Comparison
Hawaiians
Nigerians
18.7%
FEMALE POVERTY AMONG 18-24 YEAR OLDS
99.6/ 100
METRIC RATING
74th/ 347
METRIC RANK
20.4%
FEMALE POVERTY AMONG 18-24 YEAR OLDS
23.4/ 100
METRIC RATING
193rd/ 347
METRIC RANK
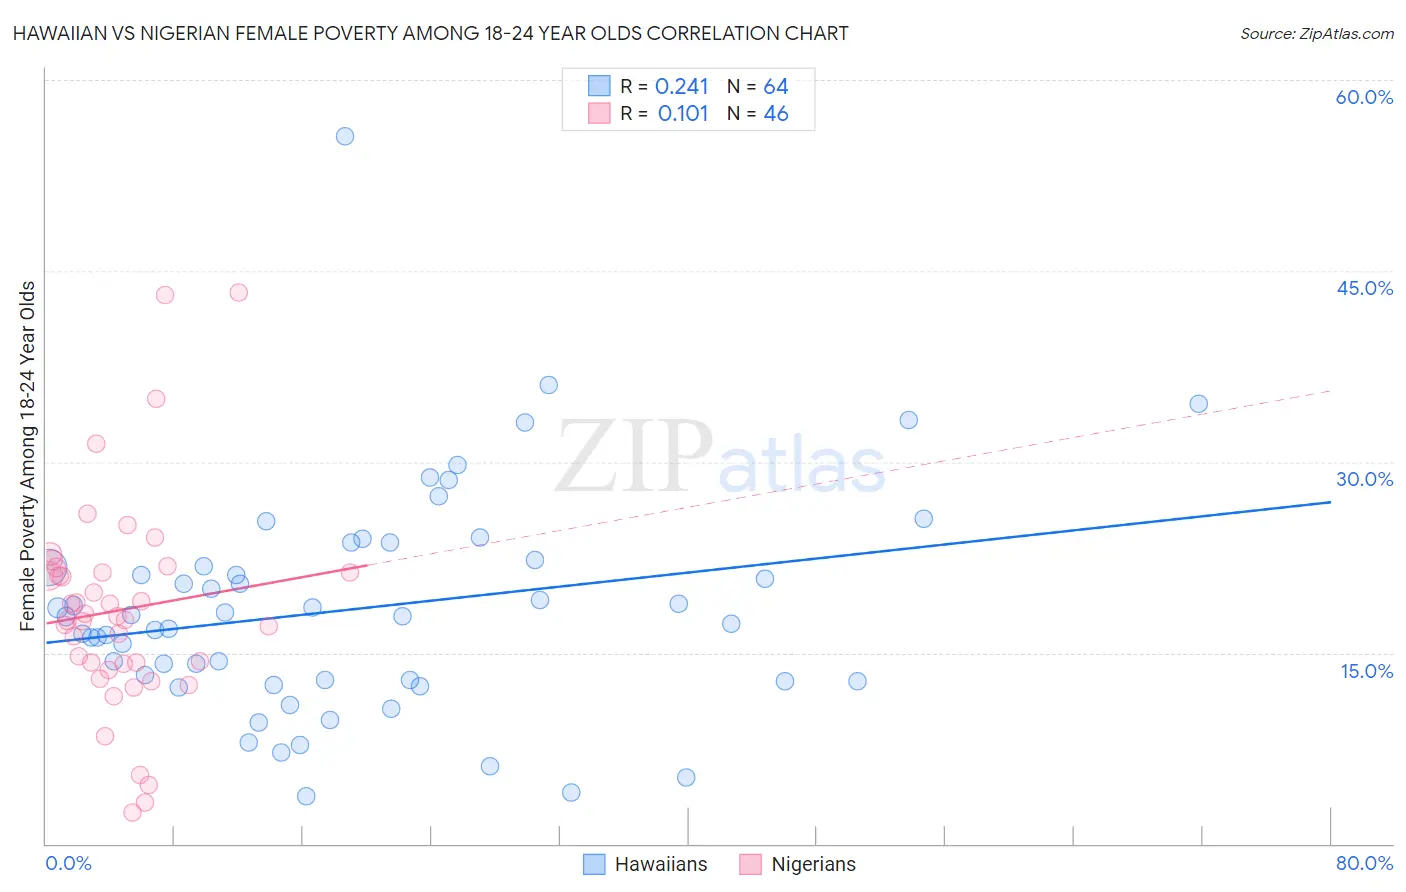
Hawaiian vs Nigerian Female Poverty Among 18-24 Year Olds Correlation Chart
The statistical analysis conducted on geographies consisting of 322,443,370 people shows a weak positive correlation between the proportion of Hawaiians and poverty level among females between the ages 18 and 24 in the United States with a correlation coefficient (R) of 0.241 and weighted average of 18.7%. Similarly, the statistical analysis conducted on geographies consisting of 327,876,042 people shows a poor positive correlation between the proportion of Nigerians and poverty level among females between the ages 18 and 24 in the United States with a correlation coefficient (R) of 0.101 and weighted average of 20.4%, a difference of 8.9%.
Female Poverty Among 18-24 Year Olds Correlation Summary
| Measurement | Hawaiian | Nigerian |
| Minimum | 3.8% | 2.5% |
| Maximum | 55.6% | 43.3% |
| Range | 51.8% | 40.9% |
| Mean | 18.5% | 18.4% |
| Median | 17.9% | 17.7% |
| Interquartile 25% (IQ1) | 12.8% | 14.2% |
| Interquartile 75% (IQ3) | 22.0% | 21.4% |
| Interquartile Range (IQR) | 9.3% | 7.2% |
| Standard Deviation (Sample) | 8.8% | 8.4% |
| Standard Deviation (Population) | 8.7% | 8.3% |
Similar Demographics by Female Poverty Among 18-24 Year Olds
Demographics Similar to Hawaiians by Female Poverty Among 18-24 Year Olds
In terms of female poverty among 18-24 year olds, the demographic groups most similar to Hawaiians are Lithuanian (18.7%, a difference of 0.19%), Polish (18.8%, a difference of 0.21%), Armenian (18.7%, a difference of 0.22%), Immigrants from Haiti (18.7%, a difference of 0.24%), and Immigrants from Cambodia (18.8%, a difference of 0.29%).
| Demographics | Rating | Rank | Female Poverty Among 18-24 Year Olds |
| Immigrants | Korea | 99.8 /100 | #67 | Exceptional 18.6% |
| Brazilians | 99.8 /100 | #68 | Exceptional 18.6% |
| Immigrants | Bulgaria | 99.7 /100 | #69 | Exceptional 18.6% |
| Immigrants | Costa Rica | 99.7 /100 | #70 | Exceptional 18.7% |
| Immigrants | Haiti | 99.7 /100 | #71 | Exceptional 18.7% |
| Armenians | 99.7 /100 | #72 | Exceptional 18.7% |
| Lithuanians | 99.7 /100 | #73 | Exceptional 18.7% |
| Hawaiians | 99.6 /100 | #74 | Exceptional 18.7% |
| Poles | 99.6 /100 | #75 | Exceptional 18.8% |
| Immigrants | Cambodia | 99.5 /100 | #76 | Exceptional 18.8% |
| Costa Ricans | 99.5 /100 | #77 | Exceptional 18.8% |
| Immigrants | Europe | 99.5 /100 | #78 | Exceptional 18.8% |
| Uruguayans | 99.5 /100 | #79 | Exceptional 18.8% |
| Palestinians | 99.5 /100 | #80 | Exceptional 18.8% |
| Japanese | 99.5 /100 | #81 | Exceptional 18.8% |
Demographics Similar to Nigerians by Female Poverty Among 18-24 Year Olds
In terms of female poverty among 18-24 year olds, the demographic groups most similar to Nigerians are Mexican American Indian (20.4%, a difference of 0.010%), Immigrants from Latvia (20.4%, a difference of 0.030%), Immigrants from Israel (20.4%, a difference of 0.070%), Czech (20.4%, a difference of 0.070%), and Moroccan (20.4%, a difference of 0.16%).
| Demographics | Rating | Rank | Female Poverty Among 18-24 Year Olds |
| Immigrants | Ethiopia | 37.3 /100 | #186 | Fair 20.2% |
| Immigrants | Mexico | 36.3 /100 | #187 | Fair 20.2% |
| Scandinavians | 34.6 /100 | #188 | Fair 20.3% |
| Immigrants | Germany | 34.0 /100 | #189 | Fair 20.3% |
| Immigrants | Western Asia | 29.3 /100 | #190 | Fair 20.3% |
| Moroccans | 25.8 /100 | #191 | Fair 20.4% |
| Immigrants | Israel | 24.4 /100 | #192 | Fair 20.4% |
| Nigerians | 23.4 /100 | #193 | Fair 20.4% |
| Mexican American Indians | 23.2 /100 | #194 | Fair 20.4% |
| Immigrants | Latvia | 23.0 /100 | #195 | Fair 20.4% |
| Czechs | 22.3 /100 | #196 | Fair 20.4% |
| Zimbabweans | 21.0 /100 | #197 | Fair 20.4% |
| Immigrants | Spain | 20.7 /100 | #198 | Fair 20.4% |
| Germans | 20.6 /100 | #199 | Fair 20.4% |
| Europeans | 19.9 /100 | #200 | Poor 20.4% |