Hawaiian vs Immigrants from Northern Africa Child Poverty Among Boys Under 16
COMPARE
Hawaiian
Immigrants from Northern Africa
Child Poverty Among Boys Under 16
Child Poverty Among Boys Under 16 Comparison
Hawaiians
Immigrants from Northern Africa
16.5%
CHILD POVERTY AMONG BOYS UNDER 16
45.5/ 100
METRIC RATING
180th/ 347
METRIC RANK
16.0%
CHILD POVERTY AMONG BOYS UNDER 16
71.3/ 100
METRIC RATING
160th/ 347
METRIC RANK
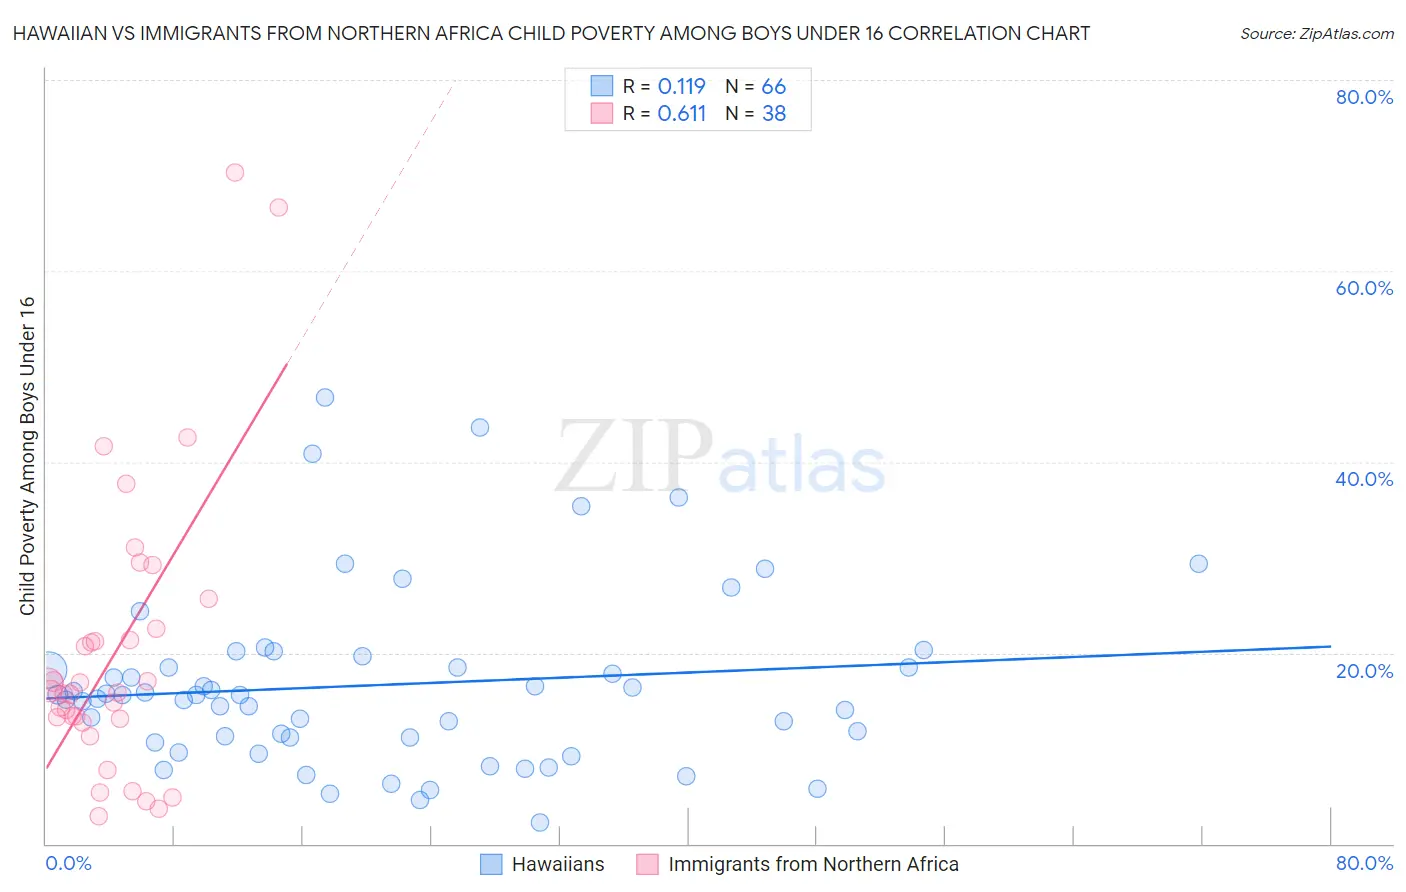
Hawaiian vs Immigrants from Northern Africa Child Poverty Among Boys Under 16 Correlation Chart
The statistical analysis conducted on geographies consisting of 324,264,970 people shows a poor positive correlation between the proportion of Hawaiians and poverty level among boys under the age of 16 in the United States with a correlation coefficient (R) of 0.119 and weighted average of 16.5%. Similarly, the statistical analysis conducted on geographies consisting of 317,001,959 people shows a significant positive correlation between the proportion of Immigrants from Northern Africa and poverty level among boys under the age of 16 in the United States with a correlation coefficient (R) of 0.611 and weighted average of 16.0%, a difference of 3.1%.
Child Poverty Among Boys Under 16 Correlation Summary
| Measurement | Hawaiian | Immigrants from Northern Africa |
| Minimum | 2.3% | 2.9% |
| Maximum | 46.7% | 70.3% |
| Range | 44.4% | 67.5% |
| Mean | 16.6% | 20.2% |
| Median | 15.6% | 15.9% |
| Interquartile 25% (IQ1) | 11.1% | 13.1% |
| Interquartile 75% (IQ3) | 18.5% | 22.5% |
| Interquartile Range (IQR) | 7.4% | 9.4% |
| Standard Deviation (Sample) | 9.2% | 15.1% |
| Standard Deviation (Population) | 9.1% | 14.9% |
Demographics Similar to Hawaiians and Immigrants from Northern Africa by Child Poverty Among Boys Under 16
In terms of child poverty among boys under 16, the demographic groups most similar to Hawaiians are Hungarian (16.5%, a difference of 0.20%), Scotch-Irish (16.5%, a difference of 0.22%), Ethiopian (16.5%, a difference of 0.26%), White/Caucasian (16.5%, a difference of 0.31%), and Immigrants from Syria (16.5%, a difference of 0.40%). Similarly, the demographic groups most similar to Immigrants from Northern Africa are Immigrants from Oceania (16.0%, a difference of 0.010%), Guamanian/Chamorro (16.1%, a difference of 0.24%), Costa Rican (16.1%, a difference of 0.44%), Immigrants from Albania (16.1%, a difference of 0.46%), and Colombian (16.1%, a difference of 0.82%).
| Demographics | Rating | Rank | Child Poverty Among Boys Under 16 |
| Immigrants | Northern Africa | 71.3 /100 | #160 | Good 16.0% |
| Immigrants | Oceania | 71.3 /100 | #161 | Good 16.0% |
| Guamanians/Chamorros | 69.6 /100 | #162 | Good 16.1% |
| Costa Ricans | 68.1 /100 | #163 | Good 16.1% |
| Immigrants | Albania | 67.9 /100 | #164 | Good 16.1% |
| Colombians | 65.2 /100 | #165 | Good 16.1% |
| Immigrants | Germany | 63.6 /100 | #166 | Good 16.2% |
| Afghans | 55.4 /100 | #167 | Average 16.3% |
| South Americans | 55.3 /100 | #168 | Average 16.3% |
| Immigrants | Saudi Arabia | 53.6 /100 | #169 | Average 16.4% |
| Immigrants | Bosnia and Herzegovina | 51.7 /100 | #170 | Average 16.4% |
| Immigrants | Ethiopia | 51.3 /100 | #171 | Average 16.4% |
| Immigrants | Colombia | 50.8 /100 | #172 | Average 16.4% |
| Tsimshian | 50.5 /100 | #173 | Average 16.4% |
| Uruguayans | 50.0 /100 | #174 | Average 16.4% |
| Immigrants | Syria | 49.0 /100 | #175 | Average 16.5% |
| Whites/Caucasians | 48.2 /100 | #176 | Average 16.5% |
| Ethiopians | 47.8 /100 | #177 | Average 16.5% |
| Scotch-Irish | 47.5 /100 | #178 | Average 16.5% |
| Hungarians | 47.3 /100 | #179 | Average 16.5% |
| Hawaiians | 45.5 /100 | #180 | Average 16.5% |