Guyanese vs Norwegian Seniors Poverty Over the Age of 65
COMPARE
Guyanese
Norwegian
Seniors Poverty Over the Age of 65
Seniors Poverty Over the Age of 65 Comparison
Guyanese
Norwegians
14.4%
SENIORS POVERTY OVER THE AGE OF 65
0.0/ 100
METRIC RATING
314th/ 347
METRIC RANK
8.7%
SENIORS POVERTY OVER THE AGE OF 65
100.0/ 100
METRIC RATING
3rd/ 347
METRIC RANK
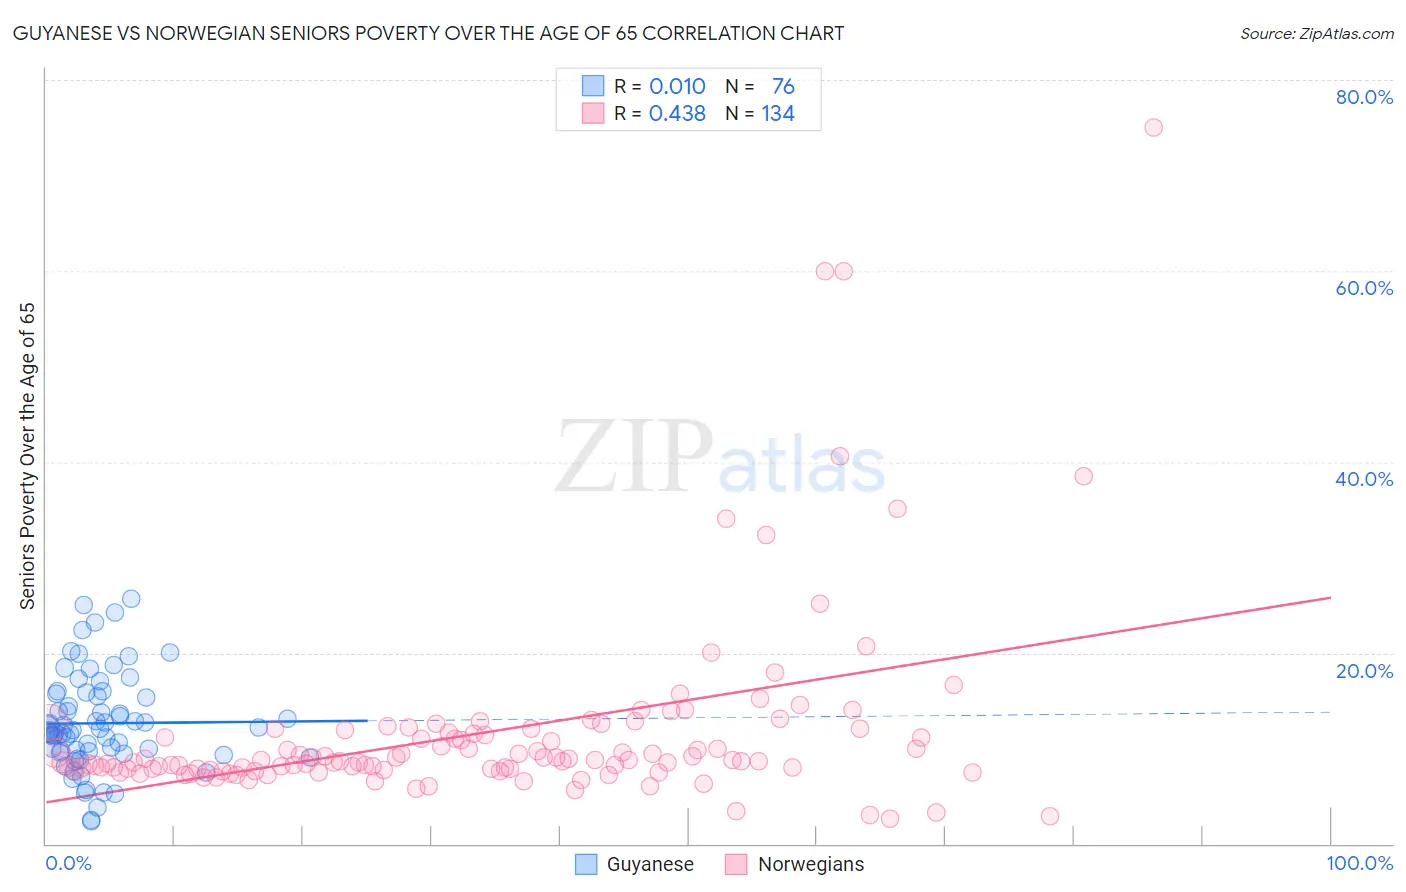
Guyanese vs Norwegian Seniors Poverty Over the Age of 65 Correlation Chart
The statistical analysis conducted on geographies consisting of 176,439,403 people shows no correlation between the proportion of Guyanese and poverty level among seniors over the age of 65 in the United States with a correlation coefficient (R) of 0.010 and weighted average of 14.4%. Similarly, the statistical analysis conducted on geographies consisting of 529,132,096 people shows a moderate positive correlation between the proportion of Norwegians and poverty level among seniors over the age of 65 in the United States with a correlation coefficient (R) of 0.438 and weighted average of 8.7%, a difference of 66.1%.
Seniors Poverty Over the Age of 65 Correlation Summary
| Measurement | Guyanese | Norwegian |
| Minimum | 2.4% | 2.6% |
| Maximum | 25.7% | 75.0% |
| Range | 23.3% | 72.4% |
| Mean | 12.6% | 11.7% |
| Median | 11.9% | 8.7% |
| Interquartile 25% (IQ1) | 9.6% | 7.8% |
| Interquartile 75% (IQ3) | 15.6% | 11.7% |
| Interquartile Range (IQR) | 6.0% | 3.8% |
| Standard Deviation (Sample) | 5.0% | 10.2% |
| Standard Deviation (Population) | 5.0% | 10.1% |
Similar Demographics by Seniors Poverty Over the Age of 65
Demographics Similar to Guyanese by Seniors Poverty Over the Age of 65
In terms of seniors poverty over the age of 65, the demographic groups most similar to Guyanese are Immigrants from Ecuador (14.4%, a difference of 0.030%), Immigrants from Guyana (14.5%, a difference of 0.24%), Haitian (14.5%, a difference of 0.27%), Barbadian (14.4%, a difference of 0.39%), and Immigrants from Honduras (14.5%, a difference of 0.49%).
| Demographics | Rating | Rank | Seniors Poverty Over the Age of 65 |
| Immigrants | West Indies | 0.0 /100 | #307 | Tragic 14.2% |
| Trinidadians and Tobagonians | 0.0 /100 | #308 | Tragic 14.2% |
| Hondurans | 0.0 /100 | #309 | Tragic 14.2% |
| Bahamians | 0.0 /100 | #310 | Tragic 14.2% |
| Natives/Alaskans | 0.0 /100 | #311 | Tragic 14.2% |
| Hispanics or Latinos | 0.0 /100 | #312 | Tragic 14.3% |
| Barbadians | 0.0 /100 | #313 | Tragic 14.4% |
| Guyanese | 0.0 /100 | #314 | Tragic 14.4% |
| Immigrants | Ecuador | 0.0 /100 | #315 | Tragic 14.4% |
| Immigrants | Guyana | 0.0 /100 | #316 | Tragic 14.5% |
| Haitians | 0.0 /100 | #317 | Tragic 14.5% |
| Immigrants | Honduras | 0.0 /100 | #318 | Tragic 14.5% |
| Cape Verdeans | 0.0 /100 | #319 | Tragic 14.7% |
| Immigrants | Haiti | 0.0 /100 | #320 | Tragic 14.7% |
| Houma | 0.0 /100 | #321 | Tragic 14.7% |
Demographics Similar to Norwegians by Seniors Poverty Over the Age of 65
In terms of seniors poverty over the age of 65, the demographic groups most similar to Norwegians are Swedish (8.7%, a difference of 0.60%), Immigrants from India (8.8%, a difference of 0.96%), Danish (8.8%, a difference of 1.4%), German (9.0%, a difference of 3.0%), and Czech (9.0%, a difference of 3.6%).
| Demographics | Rating | Rank | Seniors Poverty Over the Age of 65 |
| Chinese | 100.0 /100 | #1 | Exceptional 8.3% |
| Tlingit-Haida | 100.0 /100 | #2 | Exceptional 8.3% |
| Norwegians | 100.0 /100 | #3 | Exceptional 8.7% |
| Swedes | 100.0 /100 | #4 | Exceptional 8.7% |
| Immigrants | India | 100.0 /100 | #5 | Exceptional 8.8% |
| Danes | 100.0 /100 | #6 | Exceptional 8.8% |
| Germans | 100.0 /100 | #7 | Exceptional 9.0% |
| Czechs | 100.0 /100 | #8 | Exceptional 9.0% |
| English | 100.0 /100 | #9 | Exceptional 9.1% |
| Lithuanians | 100.0 /100 | #10 | Exceptional 9.1% |
| Maltese | 99.9 /100 | #11 | Exceptional 9.1% |
| Scandinavians | 99.9 /100 | #12 | Exceptional 9.1% |
| Croatians | 99.9 /100 | #13 | Exceptional 9.1% |
| Poles | 99.9 /100 | #14 | Exceptional 9.1% |
| Dutch | 99.9 /100 | #15 | Exceptional 9.1% |