Guyanese vs Palestinian Seniors Poverty Over the Age of 65
COMPARE
Guyanese
Palestinian
Seniors Poverty Over the Age of 65
Seniors Poverty Over the Age of 65 Comparison
Guyanese
Palestinians
14.4%
SENIORS POVERTY OVER THE AGE OF 65
0.0/ 100
METRIC RATING
314th/ 347
METRIC RANK
10.0%
SENIORS POVERTY OVER THE AGE OF 65
97.9/ 100
METRIC RATING
72nd/ 347
METRIC RANK
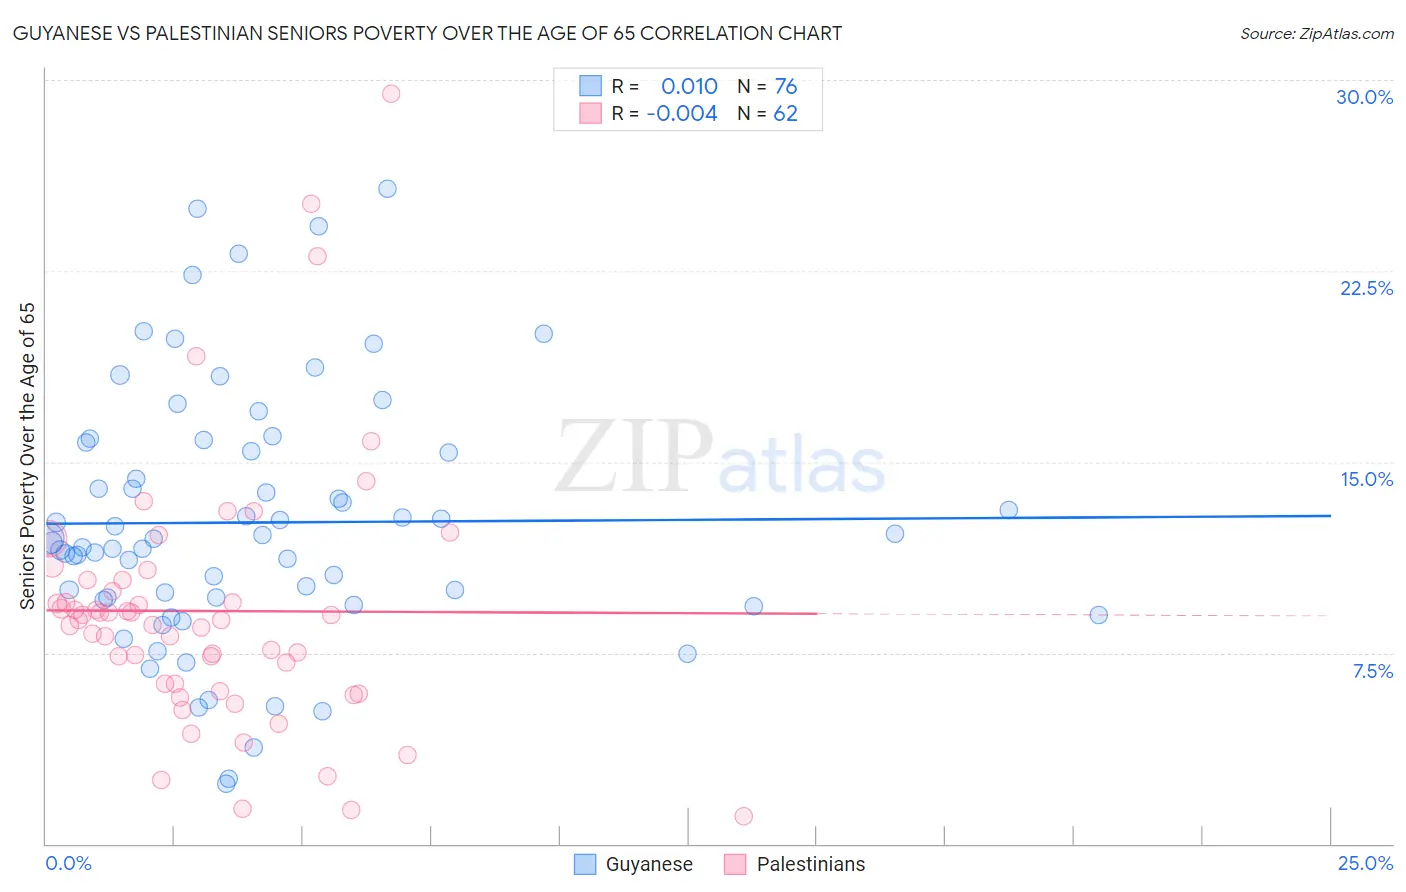
Guyanese vs Palestinian Seniors Poverty Over the Age of 65 Correlation Chart
The statistical analysis conducted on geographies consisting of 176,439,403 people shows no correlation between the proportion of Guyanese and poverty level among seniors over the age of 65 in the United States with a correlation coefficient (R) of 0.010 and weighted average of 14.4%. Similarly, the statistical analysis conducted on geographies consisting of 216,096,591 people shows no correlation between the proportion of Palestinians and poverty level among seniors over the age of 65 in the United States with a correlation coefficient (R) of -0.004 and weighted average of 10.0%, a difference of 44.2%.
Seniors Poverty Over the Age of 65 Correlation Summary
| Measurement | Guyanese | Palestinian |
| Minimum | 2.4% | 1.1% |
| Maximum | 25.7% | 29.5% |
| Range | 23.3% | 28.4% |
| Mean | 12.6% | 9.1% |
| Median | 11.9% | 8.8% |
| Interquartile 25% (IQ1) | 9.6% | 6.3% |
| Interquartile 75% (IQ3) | 15.6% | 10.4% |
| Interquartile Range (IQR) | 6.0% | 4.1% |
| Standard Deviation (Sample) | 5.0% | 5.1% |
| Standard Deviation (Population) | 5.0% | 5.1% |
Similar Demographics by Seniors Poverty Over the Age of 65
Demographics Similar to Guyanese by Seniors Poverty Over the Age of 65
In terms of seniors poverty over the age of 65, the demographic groups most similar to Guyanese are Immigrants from Ecuador (14.4%, a difference of 0.030%), Immigrants from Guyana (14.5%, a difference of 0.24%), Haitian (14.5%, a difference of 0.27%), Barbadian (14.4%, a difference of 0.39%), and Immigrants from Honduras (14.5%, a difference of 0.49%).
| Demographics | Rating | Rank | Seniors Poverty Over the Age of 65 |
| Immigrants | West Indies | 0.0 /100 | #307 | Tragic 14.2% |
| Trinidadians and Tobagonians | 0.0 /100 | #308 | Tragic 14.2% |
| Hondurans | 0.0 /100 | #309 | Tragic 14.2% |
| Bahamians | 0.0 /100 | #310 | Tragic 14.2% |
| Natives/Alaskans | 0.0 /100 | #311 | Tragic 14.2% |
| Hispanics or Latinos | 0.0 /100 | #312 | Tragic 14.3% |
| Barbadians | 0.0 /100 | #313 | Tragic 14.4% |
| Guyanese | 0.0 /100 | #314 | Tragic 14.4% |
| Immigrants | Ecuador | 0.0 /100 | #315 | Tragic 14.4% |
| Immigrants | Guyana | 0.0 /100 | #316 | Tragic 14.5% |
| Haitians | 0.0 /100 | #317 | Tragic 14.5% |
| Immigrants | Honduras | 0.0 /100 | #318 | Tragic 14.5% |
| Cape Verdeans | 0.0 /100 | #319 | Tragic 14.7% |
| Immigrants | Haiti | 0.0 /100 | #320 | Tragic 14.7% |
| Houma | 0.0 /100 | #321 | Tragic 14.7% |
Demographics Similar to Palestinians by Seniors Poverty Over the Age of 65
In terms of seniors poverty over the age of 65, the demographic groups most similar to Palestinians are Yugoslavian (10.0%, a difference of 0.020%), Russian (10.0%, a difference of 0.030%), Turkish (10.0%, a difference of 0.050%), Samoan (10.0%, a difference of 0.060%), and Immigrants from Czechoslovakia (10.0%, a difference of 0.14%).
| Demographics | Rating | Rank | Seniors Poverty Over the Age of 65 |
| Pennsylvania Germans | 98.7 /100 | #65 | Exceptional 9.9% |
| Immigrants | Netherlands | 98.7 /100 | #66 | Exceptional 9.9% |
| Immigrants | Austria | 98.6 /100 | #67 | Exceptional 9.9% |
| Canadians | 98.5 /100 | #68 | Exceptional 9.9% |
| Australians | 98.4 /100 | #69 | Exceptional 9.9% |
| Samoans | 98.0 /100 | #70 | Exceptional 10.0% |
| Yugoslavians | 97.9 /100 | #71 | Exceptional 10.0% |
| Palestinians | 97.9 /100 | #72 | Exceptional 10.0% |
| Russians | 97.9 /100 | #73 | Exceptional 10.0% |
| Turks | 97.9 /100 | #74 | Exceptional 10.0% |
| Immigrants | Czechoslovakia | 97.8 /100 | #75 | Exceptional 10.0% |
| New Zealanders | 97.7 /100 | #76 | Exceptional 10.0% |
| Immigrants | South Africa | 97.7 /100 | #77 | Exceptional 10.0% |
| Whites/Caucasians | 97.5 /100 | #78 | Exceptional 10.0% |
| Immigrants | Ireland | 97.5 /100 | #79 | Exceptional 10.0% |