Guyanese vs Norwegian 1st Grade
COMPARE
Guyanese
Norwegian
1st Grade
1st Grade Comparison
Guyanese
Norwegians
96.9%
1ST GRADE
0.0/ 100
METRIC RATING
313th/ 347
METRIC RANK
98.7%
1ST GRADE
100.0/ 100
METRIC RATING
8th/ 347
METRIC RANK
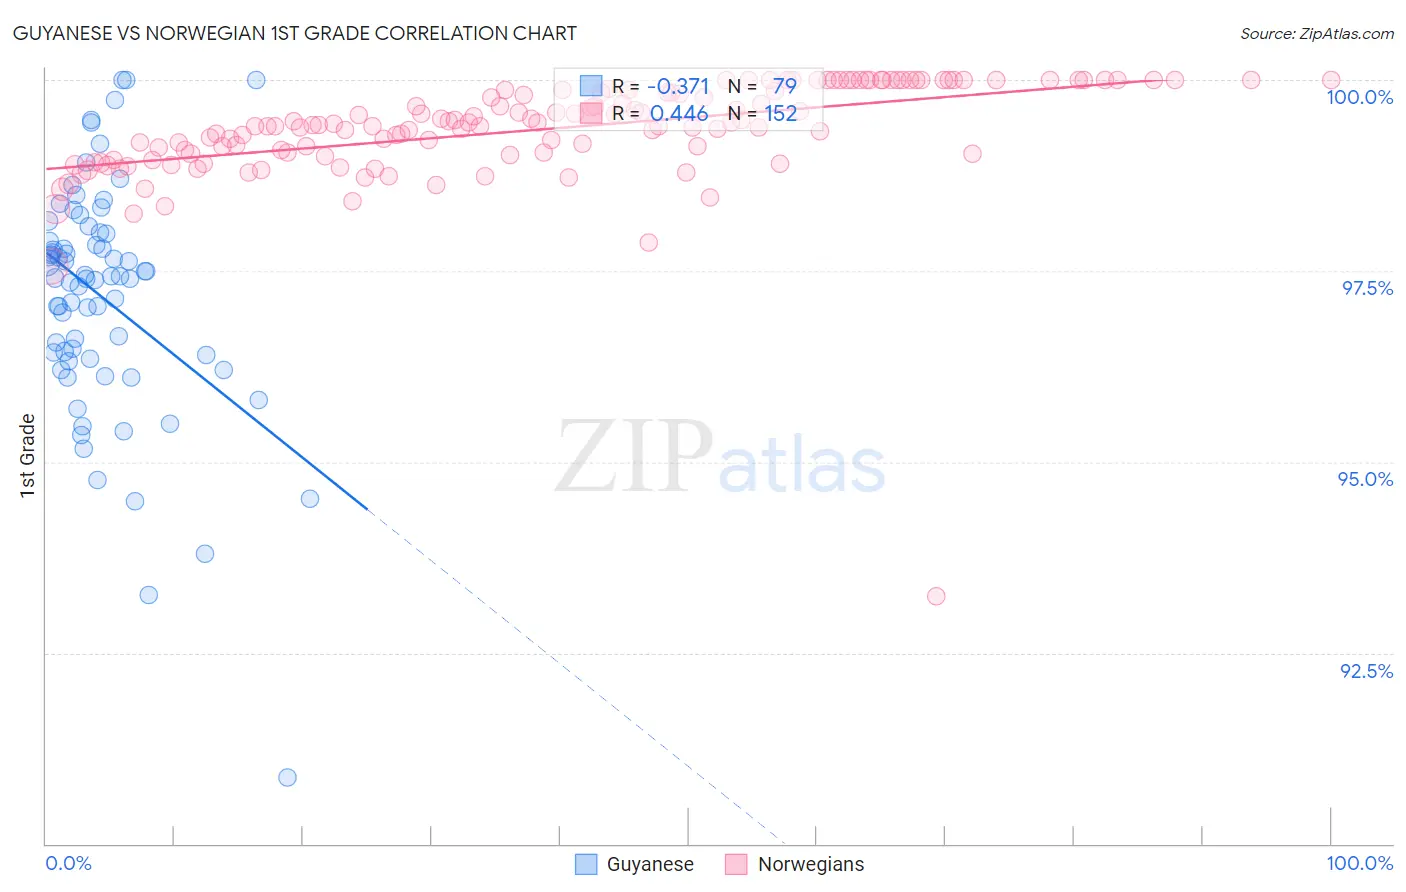
Guyanese vs Norwegian 1st Grade Correlation Chart
The statistical analysis conducted on geographies consisting of 176,921,765 people shows a mild negative correlation between the proportion of Guyanese and percentage of population with at least 1st grade education in the United States with a correlation coefficient (R) of -0.371 and weighted average of 96.9%. Similarly, the statistical analysis conducted on geographies consisting of 533,395,488 people shows a moderate positive correlation between the proportion of Norwegians and percentage of population with at least 1st grade education in the United States with a correlation coefficient (R) of 0.446 and weighted average of 98.7%, a difference of 1.9%.
1st Grade Correlation Summary
| Measurement | Guyanese | Norwegian |
| Minimum | 90.9% | 93.2% |
| Maximum | 100.0% | 100.0% |
| Range | 9.1% | 6.8% |
| Mean | 97.1% | 99.4% |
| Median | 97.4% | 99.4% |
| Interquartile 25% (IQ1) | 96.4% | 99.0% |
| Interquartile 75% (IQ3) | 98.0% | 99.9% |
| Interquartile Range (IQR) | 1.6% | 0.83% |
| Standard Deviation (Sample) | 1.5% | 0.71% |
| Standard Deviation (Population) | 1.5% | 0.71% |
Similar Demographics by 1st Grade
Demographics Similar to Guyanese by 1st Grade
In terms of 1st grade, the demographic groups most similar to Guyanese are Sri Lankan (96.9%, a difference of 0.010%), Cape Verdean (96.9%, a difference of 0.010%), Honduran (96.9%, a difference of 0.020%), Immigrants from Haiti (96.9%, a difference of 0.030%), and Immigrants from the Azores (96.9%, a difference of 0.030%).
| Demographics | Rating | Rank | 1st Grade |
| Belizeans | 0.0 /100 | #306 | Tragic 96.9% |
| Immigrants | Somalia | 0.0 /100 | #307 | Tragic 96.9% |
| Hispanics or Latinos | 0.0 /100 | #308 | Tragic 96.9% |
| Immigrants | Haiti | 0.0 /100 | #309 | Tragic 96.9% |
| Immigrants | Azores | 0.0 /100 | #310 | Tragic 96.9% |
| Sri Lankans | 0.0 /100 | #311 | Tragic 96.9% |
| Cape Verdeans | 0.0 /100 | #312 | Tragic 96.9% |
| Guyanese | 0.0 /100 | #313 | Tragic 96.9% |
| Hondurans | 0.0 /100 | #314 | Tragic 96.9% |
| Immigrants | Belize | 0.0 /100 | #315 | Tragic 96.9% |
| Immigrants | Ecuador | 0.0 /100 | #316 | Tragic 96.9% |
| Immigrants | Nicaragua | 0.0 /100 | #317 | Tragic 96.9% |
| Immigrants | Laos | 0.0 /100 | #318 | Tragic 96.8% |
| Immigrants | Guyana | 0.0 /100 | #319 | Tragic 96.8% |
| Immigrants | Burma/Myanmar | 0.0 /100 | #320 | Tragic 96.8% |
Demographics Similar to Norwegians by 1st Grade
In terms of 1st grade, the demographic groups most similar to Norwegians are Alaska Native (98.7%, a difference of 0.020%), Slovak (98.7%, a difference of 0.020%), German (98.7%, a difference of 0.020%), Tlingit-Haida (98.7%, a difference of 0.030%), and Slovene (98.7%, a difference of 0.040%).
| Demographics | Rating | Rank | 1st Grade |
| Crow | 100.0 /100 | #1 | Exceptional 99.6% |
| Yup'ik | 100.0 /100 | #2 | Exceptional 99.2% |
| Inupiat | 100.0 /100 | #3 | Exceptional 98.9% |
| Welsh | 100.0 /100 | #4 | Exceptional 98.9% |
| Tsimshian | 100.0 /100 | #5 | Exceptional 98.8% |
| Alaskan Athabascans | 100.0 /100 | #6 | Exceptional 98.8% |
| Alaska Natives | 100.0 /100 | #7 | Exceptional 98.7% |
| Norwegians | 100.0 /100 | #8 | Exceptional 98.7% |
| Slovaks | 100.0 /100 | #9 | Exceptional 98.7% |
| Germans | 100.0 /100 | #10 | Exceptional 98.7% |
| Tlingit-Haida | 100.0 /100 | #11 | Exceptional 98.7% |
| Slovenes | 100.0 /100 | #12 | Exceptional 98.7% |
| Carpatho Rusyns | 100.0 /100 | #13 | Exceptional 98.6% |
| English | 100.0 /100 | #14 | Exceptional 98.6% |
| Swedes | 100.0 /100 | #15 | Exceptional 98.6% |