Guyanese vs Immigrants from Panama Child Poverty Among Girls Under 16
COMPARE
Guyanese
Immigrants from Panama
Child Poverty Among Girls Under 16
Child Poverty Among Girls Under 16 Comparison
Guyanese
Immigrants from Panama
19.4%
CHILD POVERTY AMONG GIRLS UNDER 16
0.2/ 100
METRIC RATING
257th/ 347
METRIC RANK
17.9%
CHILD POVERTY AMONG GIRLS UNDER 16
4.7/ 100
METRIC RATING
219th/ 347
METRIC RANK
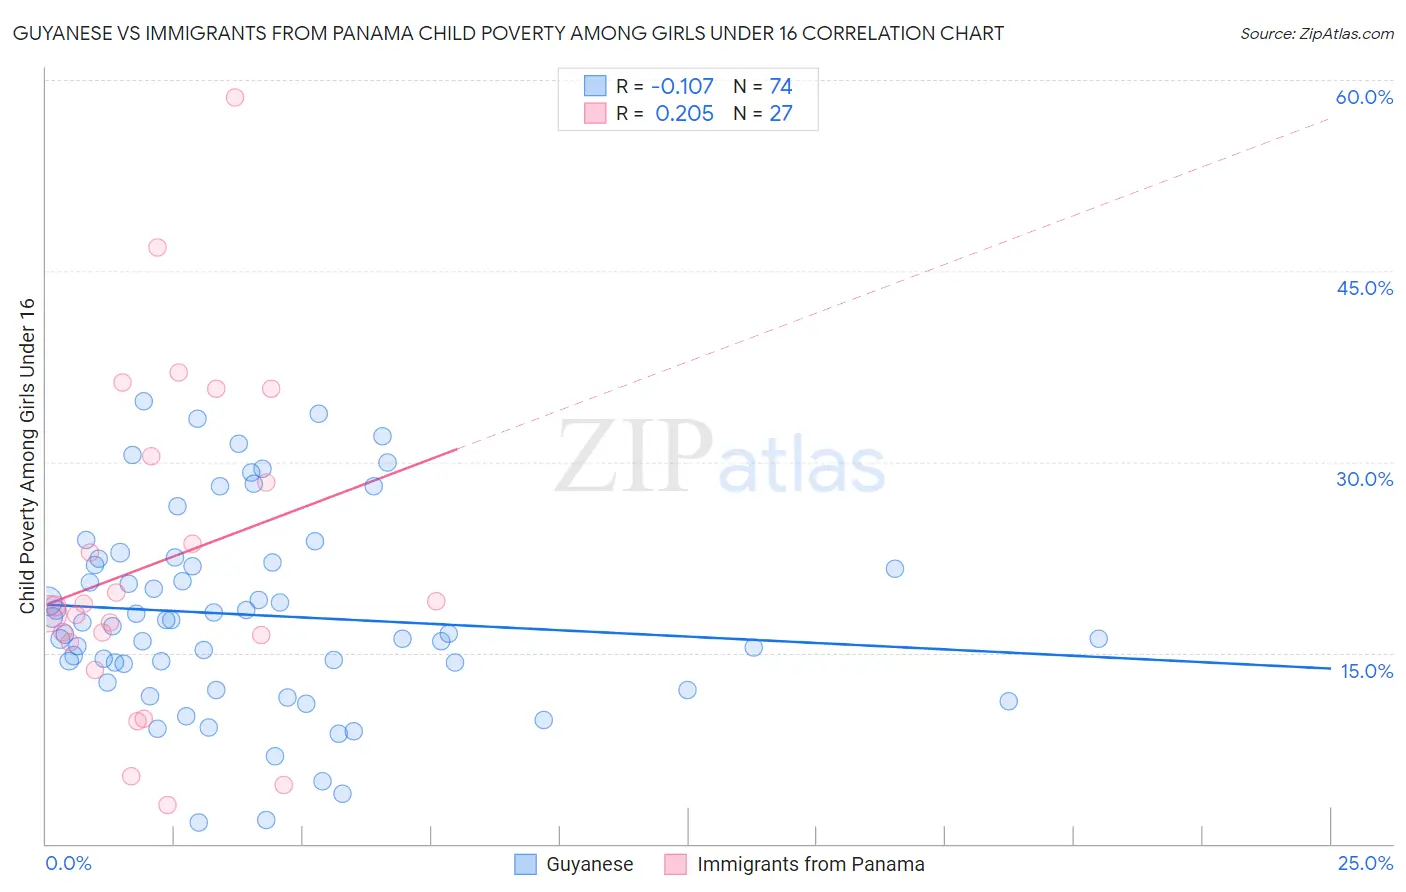
Guyanese vs Immigrants from Panama Child Poverty Among Girls Under 16 Correlation Chart
The statistical analysis conducted on geographies consisting of 175,189,173 people shows a poor negative correlation between the proportion of Guyanese and poverty level among girls under the age of 16 in the United States with a correlation coefficient (R) of -0.107 and weighted average of 19.4%. Similarly, the statistical analysis conducted on geographies consisting of 219,710,792 people shows a weak positive correlation between the proportion of Immigrants from Panama and poverty level among girls under the age of 16 in the United States with a correlation coefficient (R) of 0.205 and weighted average of 17.9%, a difference of 8.2%.
Child Poverty Among Girls Under 16 Correlation Summary
| Measurement | Guyanese | Immigrants from Panama |
| Minimum | 1.7% | 3.0% |
| Maximum | 34.8% | 58.7% |
| Range | 33.1% | 55.7% |
| Mean | 18.0% | 22.1% |
| Median | 17.2% | 18.7% |
| Interquartile 25% (IQ1) | 14.1% | 15.8% |
| Interquartile 75% (IQ3) | 22.1% | 30.4% |
| Interquartile Range (IQR) | 8.0% | 14.6% |
| Standard Deviation (Sample) | 7.6% | 13.0% |
| Standard Deviation (Population) | 7.5% | 12.8% |
Similar Demographics by Child Poverty Among Girls Under 16
Demographics Similar to Guyanese by Child Poverty Among Girls Under 16
In terms of child poverty among girls under 16, the demographic groups most similar to Guyanese are Salvadoran (19.4%, a difference of 0.13%), Ottawa (19.4%, a difference of 0.23%), Trinidadian and Tobagonian (19.3%, a difference of 0.25%), Immigrants from Ecuador (19.3%, a difference of 0.31%), and Immigrants from Western Africa (19.3%, a difference of 0.33%).
| Demographics | Rating | Rank | Child Poverty Among Girls Under 16 |
| Cape Verdeans | 0.3 /100 | #250 | Tragic 19.2% |
| Immigrants | Trinidad and Tobago | 0.3 /100 | #251 | Tragic 19.2% |
| Immigrants | Middle Africa | 0.3 /100 | #252 | Tragic 19.2% |
| Immigrants | Guyana | 0.3 /100 | #253 | Tragic 19.3% |
| Immigrants | Western Africa | 0.3 /100 | #254 | Tragic 19.3% |
| Immigrants | Ecuador | 0.3 /100 | #255 | Tragic 19.3% |
| Trinidadians and Tobagonians | 0.2 /100 | #256 | Tragic 19.3% |
| Guyanese | 0.2 /100 | #257 | Tragic 19.4% |
| Salvadorans | 0.2 /100 | #258 | Tragic 19.4% |
| Ottawa | 0.2 /100 | #259 | Tragic 19.4% |
| Mexican American Indians | 0.2 /100 | #260 | Tragic 19.5% |
| Vietnamese | 0.2 /100 | #261 | Tragic 19.5% |
| Chickasaw | 0.1 /100 | #262 | Tragic 19.6% |
| Immigrants | Burma/Myanmar | 0.1 /100 | #263 | Tragic 19.7% |
| Jamaicans | 0.1 /100 | #264 | Tragic 19.7% |
Demographics Similar to Immigrants from Panama by Child Poverty Among Girls Under 16
In terms of child poverty among girls under 16, the demographic groups most similar to Immigrants from Panama are Alaska Native (17.8%, a difference of 0.24%), Japanese (17.8%, a difference of 0.34%), Cuban (18.0%, a difference of 0.38%), Moroccan (17.8%, a difference of 0.43%), and Malaysian (17.8%, a difference of 0.53%).
| Demographics | Rating | Rank | Child Poverty Among Girls Under 16 |
| Immigrants | Thailand | 6.3 /100 | #212 | Tragic 17.7% |
| Pennsylvania Germans | 5.7 /100 | #213 | Tragic 17.8% |
| Malaysians | 5.7 /100 | #214 | Tragic 17.8% |
| German Russians | 5.7 /100 | #215 | Tragic 17.8% |
| Moroccans | 5.5 /100 | #216 | Tragic 17.8% |
| Japanese | 5.3 /100 | #217 | Tragic 17.8% |
| Alaska Natives | 5.2 /100 | #218 | Tragic 17.8% |
| Immigrants | Panama | 4.7 /100 | #219 | Tragic 17.9% |
| Cubans | 4.1 /100 | #220 | Tragic 18.0% |
| Immigrants | Micronesia | 3.5 /100 | #221 | Tragic 18.0% |
| Immigrants | Cambodia | 2.9 /100 | #222 | Tragic 18.1% |
| Immigrants | Armenia | 2.9 /100 | #223 | Tragic 18.1% |
| Bermudans | 2.8 /100 | #224 | Tragic 18.1% |
| Immigrants | Africa | 2.7 /100 | #225 | Tragic 18.2% |
| Nicaraguans | 2.4 /100 | #226 | Tragic 18.2% |