Guyanese vs Liberian Child Poverty Under the Age of 5
COMPARE
Guyanese
Liberian
Child Poverty Under the Age of 5
Child Poverty Under the Age of 5 Comparison
Guyanese
Liberians
19.7%
CHILD POVERTY UNDER THE AGE OF 5
0.4/ 100
METRIC RATING
247th/ 347
METRIC RANK
20.2%
CHILD POVERTY UNDER THE AGE OF 5
0.1/ 100
METRIC RATING
262nd/ 347
METRIC RANK
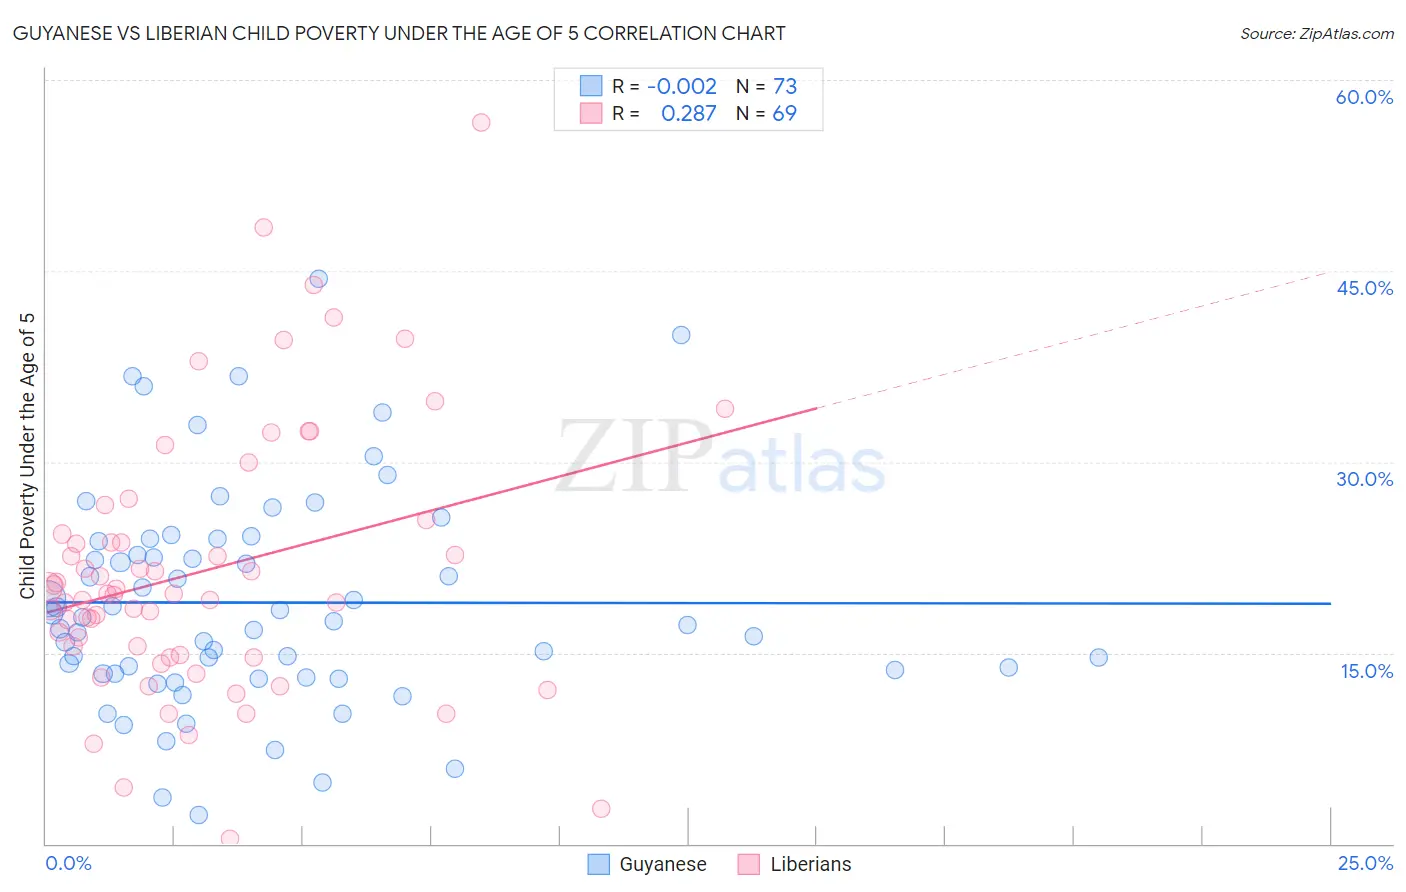
Guyanese vs Liberian Child Poverty Under the Age of 5 Correlation Chart
The statistical analysis conducted on geographies consisting of 172,709,011 people shows no correlation between the proportion of Guyanese and poverty level among children under the age of 5 in the United States with a correlation coefficient (R) of -0.002 and weighted average of 19.7%. Similarly, the statistical analysis conducted on geographies consisting of 116,697,175 people shows a weak positive correlation between the proportion of Liberians and poverty level among children under the age of 5 in the United States with a correlation coefficient (R) of 0.287 and weighted average of 20.2%, a difference of 2.2%.
Child Poverty Under the Age of 5 Correlation Summary
| Measurement | Guyanese | Liberian |
| Minimum | 2.2% | 0.41% |
| Maximum | 44.4% | 56.7% |
| Range | 42.1% | 56.3% |
| Mean | 18.9% | 21.4% |
| Median | 17.5% | 19.7% |
| Interquartile 25% (IQ1) | 13.4% | 14.7% |
| Interquartile 75% (IQ3) | 23.9% | 24.9% |
| Interquartile Range (IQR) | 10.5% | 10.2% |
| Standard Deviation (Sample) | 8.5% | 10.5% |
| Standard Deviation (Population) | 8.5% | 10.4% |
Demographics Similar to Guyanese and Liberians by Child Poverty Under the Age of 5
In terms of child poverty under the age of 5, the demographic groups most similar to Guyanese are Marshallese (19.7%, a difference of 0.010%), Immigrants from Middle Africa (19.7%, a difference of 0.030%), Nonimmigrants (19.7%, a difference of 0.080%), Cree (19.7%, a difference of 0.16%), and Immigrants from Western Africa (19.7%, a difference of 0.23%). Similarly, the demographic groups most similar to Liberians are Barbadian (20.2%, a difference of 0.070%), Immigrants from Liberia (20.2%, a difference of 0.19%), Immigrants from Bangladesh (20.1%, a difference of 0.41%), Spanish American (20.1%, a difference of 0.45%), and Immigrants from El Salvador (20.0%, a difference of 0.85%).
| Demographics | Rating | Rank | Child Poverty Under the Age of 5 |
| Immigrants | Ghana | 0.5 /100 | #244 | Tragic 19.6% |
| Immigrants | Western Africa | 0.4 /100 | #245 | Tragic 19.7% |
| Cree | 0.4 /100 | #246 | Tragic 19.7% |
| Guyanese | 0.4 /100 | #247 | Tragic 19.7% |
| Marshallese | 0.4 /100 | #248 | Tragic 19.7% |
| Immigrants | Middle Africa | 0.4 /100 | #249 | Tragic 19.7% |
| Immigrants | Nonimmigrants | 0.4 /100 | #250 | Tragic 19.7% |
| Pennsylvania Germans | 0.3 /100 | #251 | Tragic 19.8% |
| Immigrants | Nicaragua | 0.3 /100 | #252 | Tragic 19.8% |
| Mexican American Indians | 0.3 /100 | #253 | Tragic 19.9% |
| Fijians | 0.3 /100 | #254 | Tragic 19.9% |
| Immigrants | Cuba | 0.2 /100 | #255 | Tragic 19.9% |
| Immigrants | Barbados | 0.2 /100 | #256 | Tragic 20.0% |
| Shoshone | 0.2 /100 | #257 | Tragic 20.0% |
| Immigrants | St. Vincent and the Grenadines | 0.2 /100 | #258 | Tragic 20.0% |
| Immigrants | El Salvador | 0.2 /100 | #259 | Tragic 20.0% |
| Spanish Americans | 0.2 /100 | #260 | Tragic 20.1% |
| Immigrants | Bangladesh | 0.2 /100 | #261 | Tragic 20.1% |
| Liberians | 0.1 /100 | #262 | Tragic 20.2% |
| Barbadians | 0.1 /100 | #263 | Tragic 20.2% |
| Immigrants | Liberia | 0.1 /100 | #264 | Tragic 20.2% |