Guamanian/Chamorro vs Welsh In Labor Force | Age 20-24
COMPARE
Guamanian/Chamorro
Welsh
In Labor Force | Age 20-24
In Labor Force | Age 20-24 Comparison
Guamanians/Chamorros
Welsh
76.7%
IN LABOR FORCE | AGE 20-24
99.8/ 100
METRIC RATING
72nd/ 347
METRIC RANK
77.5%
IN LABOR FORCE | AGE 20-24
100.0/ 100
METRIC RATING
36th/ 347
METRIC RANK
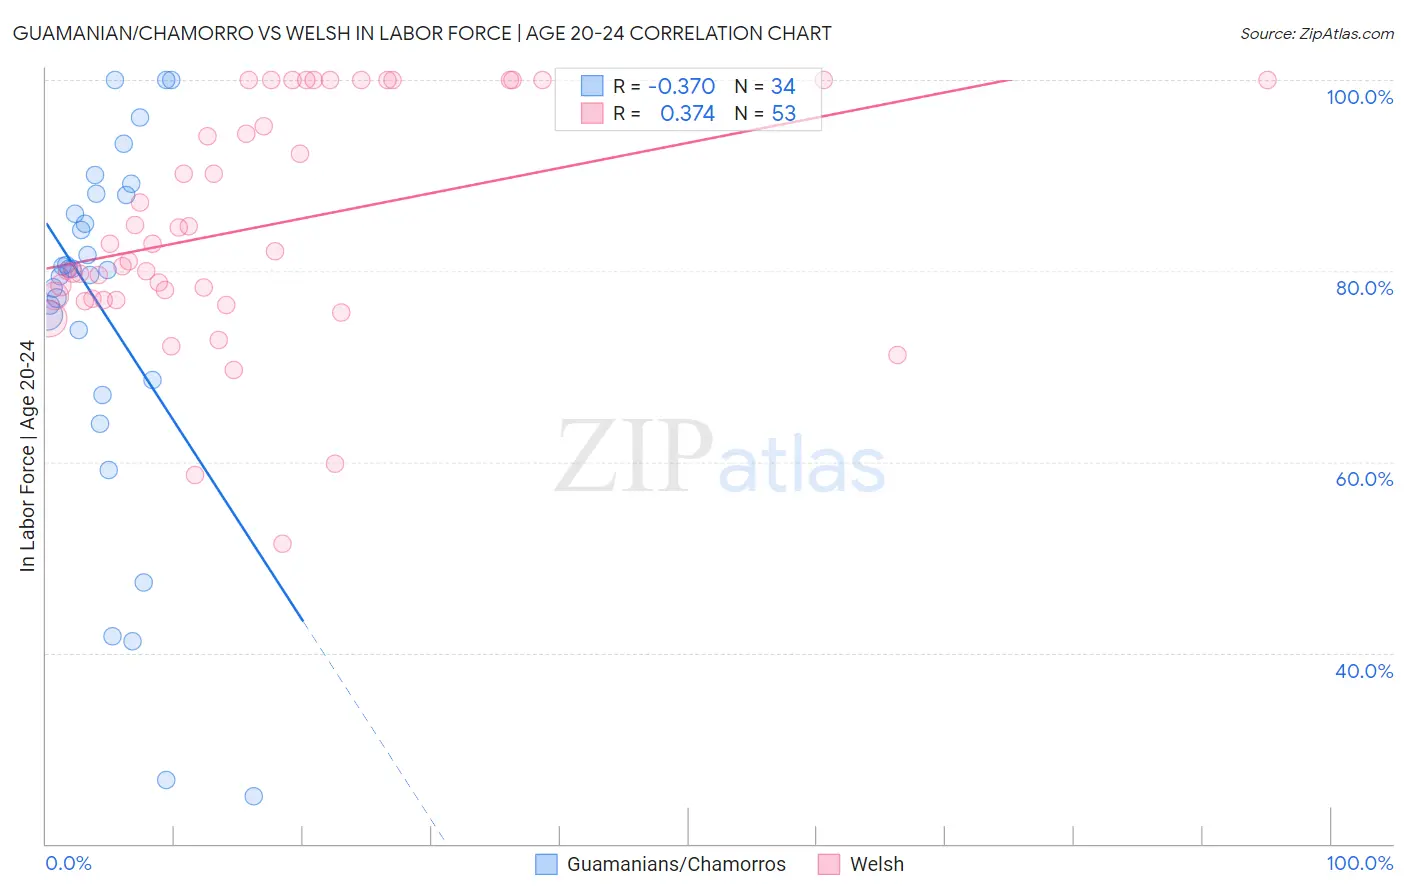
Guamanian/Chamorro vs Welsh In Labor Force | Age 20-24 Correlation Chart
The statistical analysis conducted on geographies consisting of 221,886,711 people shows a mild negative correlation between the proportion of Guamanians/Chamorros and labor force participation rate among population between the ages 20 and 24 in the United States with a correlation coefficient (R) of -0.370 and weighted average of 76.7%. Similarly, the statistical analysis conducted on geographies consisting of 527,767,201 people shows a mild positive correlation between the proportion of Welsh and labor force participation rate among population between the ages 20 and 24 in the United States with a correlation coefficient (R) of 0.374 and weighted average of 77.5%, a difference of 0.98%.
In Labor Force | Age 20-24 Correlation Summary
| Measurement | Guamanian/Chamorro | Welsh |
| Minimum | 25.0% | 51.4% |
| Maximum | 100.0% | 100.0% |
| Range | 75.0% | 48.6% |
| Mean | 75.4% | 84.7% |
| Median | 80.2% | 82.1% |
| Interquartile 25% (IQ1) | 68.6% | 77.1% |
| Interquartile 75% (IQ3) | 88.0% | 100.0% |
| Interquartile Range (IQR) | 19.4% | 22.9% |
| Standard Deviation (Sample) | 19.3% | 12.1% |
| Standard Deviation (Population) | 19.0% | 12.0% |
Similar Demographics by In Labor Force | Age 20-24
Demographics Similar to Guamanians/Chamorros by In Labor Force | Age 20-24
In terms of in labor force | age 20-24, the demographic groups most similar to Guamanians/Chamorros are Northern European (76.8%, a difference of 0.030%), British (76.7%, a difference of 0.050%), Ottawa (76.8%, a difference of 0.10%), Immigrants from Sudan (76.8%, a difference of 0.11%), and Cree (76.6%, a difference of 0.12%).
| Demographics | Rating | Rank | In Labor Force | Age 20-24 |
| Crow | 99.9 /100 | #65 | Exceptional 76.9% |
| Icelanders | 99.9 /100 | #66 | Exceptional 76.9% |
| Slavs | 99.9 /100 | #67 | Exceptional 76.9% |
| French American Indians | 99.8 /100 | #68 | Exceptional 76.8% |
| Immigrants | Sudan | 99.8 /100 | #69 | Exceptional 76.8% |
| Ottawa | 99.8 /100 | #70 | Exceptional 76.8% |
| Northern Europeans | 99.8 /100 | #71 | Exceptional 76.8% |
| Guamanians/Chamorros | 99.8 /100 | #72 | Exceptional 76.7% |
| British | 99.8 /100 | #73 | Exceptional 76.7% |
| Cree | 99.7 /100 | #74 | Exceptional 76.6% |
| Immigrants | Middle Africa | 99.7 /100 | #75 | Exceptional 76.6% |
| Immigrants | Moldova | 99.6 /100 | #76 | Exceptional 76.6% |
| Immigrants | Cameroon | 99.6 /100 | #77 | Exceptional 76.6% |
| Canadians | 99.6 /100 | #78 | Exceptional 76.6% |
| Immigrants | Zaire | 99.6 /100 | #79 | Exceptional 76.6% |
Demographics Similar to Welsh by In Labor Force | Age 20-24
In terms of in labor force | age 20-24, the demographic groups most similar to Welsh are Czechoslovakian (77.5%, a difference of 0.010%), Immigrants from Eastern Africa (77.5%, a difference of 0.020%), German Russian (77.5%, a difference of 0.030%), Immigrants from Ethiopia (77.5%, a difference of 0.040%), and Marshallese (77.4%, a difference of 0.070%).
| Demographics | Rating | Rank | In Labor Force | Age 20-24 |
| Slovaks | 100.0 /100 | #29 | Exceptional 77.7% |
| Swiss | 100.0 /100 | #30 | Exceptional 77.7% |
| Poles | 100.0 /100 | #31 | Exceptional 77.6% |
| English | 100.0 /100 | #32 | Exceptional 77.6% |
| Immigrants | Ethiopia | 100.0 /100 | #33 | Exceptional 77.5% |
| German Russians | 100.0 /100 | #34 | Exceptional 77.5% |
| Immigrants | Eastern Africa | 100.0 /100 | #35 | Exceptional 77.5% |
| Welsh | 100.0 /100 | #36 | Exceptional 77.5% |
| Czechoslovakians | 100.0 /100 | #37 | Exceptional 77.5% |
| Marshallese | 100.0 /100 | #38 | Exceptional 77.4% |
| Irish | 100.0 /100 | #39 | Exceptional 77.4% |
| Scottish | 100.0 /100 | #40 | Exceptional 77.4% |
| Immigrants | Congo | 100.0 /100 | #41 | Exceptional 77.4% |
| French | 100.0 /100 | #42 | Exceptional 77.4% |
| Immigrants | Laos | 100.0 /100 | #43 | Exceptional 77.4% |