Mexican vs Native Hawaiian Seniors Poverty Over the Age of 65
COMPARE
Mexican
Native Hawaiian
Seniors Poverty Over the Age of 65
Seniors Poverty Over the Age of 65 Comparison
Mexicans
Native Hawaiians
13.1%
SENIORS POVERTY OVER THE AGE OF 65
0.0/ 100
METRIC RATING
279th/ 347
METRIC RANK
9.4%
SENIORS POVERTY OVER THE AGE OF 65
99.8/ 100
METRIC RATING
33rd/ 347
METRIC RANK
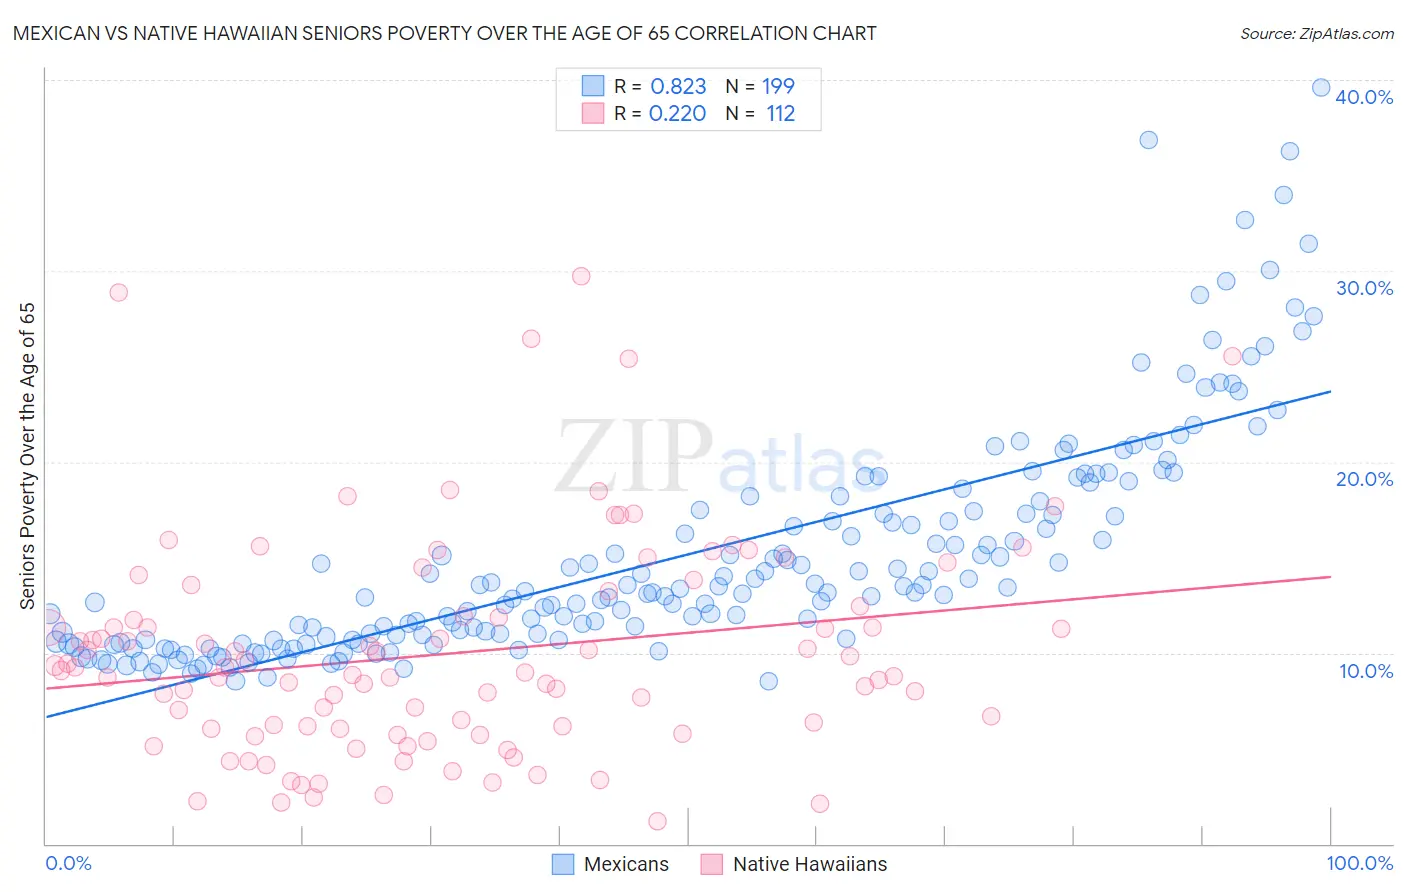
Mexican vs Native Hawaiian Seniors Poverty Over the Age of 65 Correlation Chart
The statistical analysis conducted on geographies consisting of 560,231,144 people shows a very strong positive correlation between the proportion of Mexicans and poverty level among seniors over the age of 65 in the United States with a correlation coefficient (R) of 0.823 and weighted average of 13.1%. Similarly, the statistical analysis conducted on geographies consisting of 330,714,575 people shows a weak positive correlation between the proportion of Native Hawaiians and poverty level among seniors over the age of 65 in the United States with a correlation coefficient (R) of 0.220 and weighted average of 9.4%, a difference of 38.9%.
Seniors Poverty Over the Age of 65 Correlation Summary
| Measurement | Mexican | Native Hawaiian |
| Minimum | 8.5% | 1.2% |
| Maximum | 39.6% | 29.8% |
| Range | 31.1% | 28.6% |
| Mean | 15.1% | 10.0% |
| Median | 13.2% | 9.0% |
| Interquartile 25% (IQ1) | 10.7% | 6.0% |
| Interquartile 75% (IQ3) | 17.4% | 12.2% |
| Interquartile Range (IQR) | 6.7% | 6.1% |
| Standard Deviation (Sample) | 6.0% | 5.7% |
| Standard Deviation (Population) | 6.0% | 5.6% |
Similar Demographics by Seniors Poverty Over the Age of 65
Demographics Similar to Mexicans by Seniors Poverty Over the Age of 65
In terms of seniors poverty over the age of 65, the demographic groups most similar to Mexicans are Yuman (13.1%, a difference of 0.040%), Immigrants from Bahamas (13.0%, a difference of 0.16%), Immigrants from El Salvador (13.1%, a difference of 0.48%), Paiute (12.9%, a difference of 0.98%), and Immigrants from the Azores (12.9%, a difference of 1.1%).
| Demographics | Rating | Rank | Seniors Poverty Over the Age of 65 |
| Immigrants | Uruguay | 0.1 /100 | #272 | Tragic 12.8% |
| Kiowa | 0.0 /100 | #273 | Tragic 12.8% |
| Salvadorans | 0.0 /100 | #274 | Tragic 12.8% |
| Immigrants | Colombia | 0.0 /100 | #275 | Tragic 12.9% |
| Immigrants | Azores | 0.0 /100 | #276 | Tragic 12.9% |
| Paiute | 0.0 /100 | #277 | Tragic 12.9% |
| Immigrants | Bahamas | 0.0 /100 | #278 | Tragic 13.0% |
| Mexicans | 0.0 /100 | #279 | Tragic 13.1% |
| Yuman | 0.0 /100 | #280 | Tragic 13.1% |
| Immigrants | El Salvador | 0.0 /100 | #281 | Tragic 13.1% |
| Senegalese | 0.0 /100 | #282 | Tragic 13.3% |
| Central Americans | 0.0 /100 | #283 | Tragic 13.4% |
| Colville | 0.0 /100 | #284 | Tragic 13.5% |
| Guatemalans | 0.0 /100 | #285 | Tragic 13.5% |
| Immigrants | Senegal | 0.0 /100 | #286 | Tragic 13.6% |
Demographics Similar to Native Hawaiians by Seniors Poverty Over the Age of 65
In terms of seniors poverty over the age of 65, the demographic groups most similar to Native Hawaiians are Northern European (9.4%, a difference of 0.020%), British (9.4%, a difference of 0.10%), Finnish (9.4%, a difference of 0.30%), Latvian (9.5%, a difference of 0.48%), and Menominee (9.4%, a difference of 0.52%).
| Demographics | Rating | Rank | Seniors Poverty Over the Age of 65 |
| Immigrants | Scotland | 99.9 /100 | #26 | Exceptional 9.3% |
| Italians | 99.9 /100 | #27 | Exceptional 9.3% |
| Tongans | 99.9 /100 | #28 | Exceptional 9.3% |
| Bhutanese | 99.9 /100 | #29 | Exceptional 9.3% |
| Menominee | 99.8 /100 | #30 | Exceptional 9.4% |
| Finns | 99.8 /100 | #31 | Exceptional 9.4% |
| Northern Europeans | 99.8 /100 | #32 | Exceptional 9.4% |
| Native Hawaiians | 99.8 /100 | #33 | Exceptional 9.4% |
| British | 99.8 /100 | #34 | Exceptional 9.4% |
| Latvians | 99.8 /100 | #35 | Exceptional 9.5% |
| Czechoslovakians | 99.8 /100 | #36 | Exceptional 9.5% |
| Scotch-Irish | 99.7 /100 | #37 | Exceptional 9.5% |
| Belgians | 99.7 /100 | #38 | Exceptional 9.5% |
| Greeks | 99.6 /100 | #39 | Exceptional 9.6% |
| Assyrians/Chaldeans/Syriacs | 99.6 /100 | #40 | Exceptional 9.6% |