Guamanian/Chamorro vs Korean Male Poverty
COMPARE
Guamanian/Chamorro
Korean
Male Poverty
Male Poverty Comparison
Guamanians/Chamorros
Koreans
11.0%
MALE POVERTY
67.6/ 100
METRIC RATING
150th/ 347
METRIC RANK
9.9%
MALE POVERTY
99.2/ 100
METRIC RATING
41st/ 347
METRIC RANK
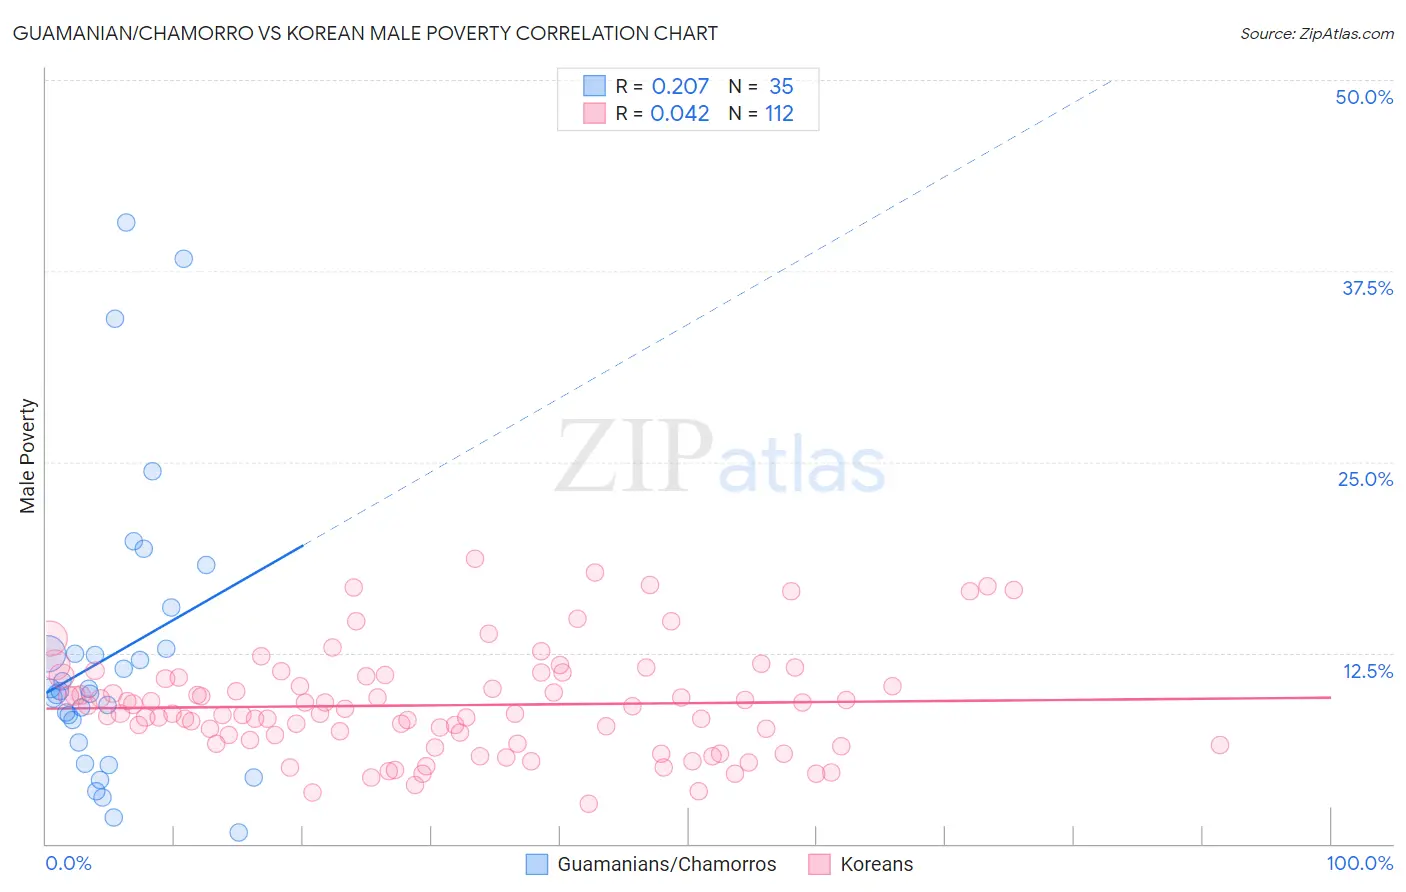
Guamanian/Chamorro vs Korean Male Poverty Correlation Chart
The statistical analysis conducted on geographies consisting of 221,842,342 people shows a weak positive correlation between the proportion of Guamanians/Chamorros and poverty level among males in the United States with a correlation coefficient (R) of 0.207 and weighted average of 11.0%. Similarly, the statistical analysis conducted on geographies consisting of 510,064,453 people shows no correlation between the proportion of Koreans and poverty level among males in the United States with a correlation coefficient (R) of 0.042 and weighted average of 9.9%, a difference of 11.3%.
Male Poverty Correlation Summary
| Measurement | Guamanian/Chamorro | Korean |
| Minimum | 0.76% | 2.6% |
| Maximum | 40.6% | 18.6% |
| Range | 39.9% | 16.0% |
| Mean | 12.3% | 9.1% |
| Median | 10.0% | 8.5% |
| Interquartile 25% (IQ1) | 6.6% | 6.7% |
| Interquartile 75% (IQ3) | 12.7% | 10.9% |
| Interquartile Range (IQR) | 6.1% | 4.2% |
| Standard Deviation (Sample) | 9.5% | 3.4% |
| Standard Deviation (Population) | 9.3% | 3.4% |
Similar Demographics by Male Poverty
Demographics Similar to Guamanians/Chamorros by Male Poverty
In terms of male poverty, the demographic groups most similar to Guamanians/Chamorros are Venezuelan (11.0%, a difference of 0.020%), Immigrants from Nepal (11.0%, a difference of 0.030%), Immigrants from Venezuela (11.0%, a difference of 0.040%), Armenian (11.0%, a difference of 0.050%), and Icelander (11.0%, a difference of 0.11%).
| Demographics | Rating | Rank | Male Poverty |
| Afghans | 71.9 /100 | #143 | Good 10.9% |
| Samoans | 71.8 /100 | #144 | Good 10.9% |
| Immigrants | Germany | 71.6 /100 | #145 | Good 10.9% |
| Syrians | 71.4 /100 | #146 | Good 10.9% |
| Icelanders | 68.5 /100 | #147 | Good 11.0% |
| Armenians | 68.0 /100 | #148 | Good 11.0% |
| Immigrants | Venezuela | 67.9 /100 | #149 | Good 11.0% |
| Guamanians/Chamorros | 67.6 /100 | #150 | Good 11.0% |
| Venezuelans | 67.4 /100 | #151 | Good 11.0% |
| Immigrants | Nepal | 67.3 /100 | #152 | Good 11.0% |
| Immigrants | Bosnia and Herzegovina | 65.2 /100 | #153 | Good 11.0% |
| Immigrants | Kazakhstan | 64.8 /100 | #154 | Good 11.0% |
| Immigrants | Malaysia | 64.7 /100 | #155 | Good 11.0% |
| Costa Ricans | 63.9 /100 | #156 | Good 11.0% |
| Scotch-Irish | 63.7 /100 | #157 | Good 11.0% |
Demographics Similar to Koreans by Male Poverty
In terms of male poverty, the demographic groups most similar to Koreans are Cypriot (9.9%, a difference of 0.10%), Russian (9.9%, a difference of 0.17%), Immigrants from Pakistan (9.9%, a difference of 0.18%), Immigrants from Iran (9.9%, a difference of 0.24%), and Immigrants from Moldova (9.9%, a difference of 0.50%).
| Demographics | Rating | Rank | Male Poverty |
| Immigrants | Poland | 99.5 /100 | #34 | Exceptional 9.8% |
| Iranians | 99.4 /100 | #35 | Exceptional 9.8% |
| Czechs | 99.4 /100 | #36 | Exceptional 9.8% |
| Immigrants | Greece | 99.3 /100 | #37 | Exceptional 9.8% |
| Immigrants | Pakistan | 99.2 /100 | #38 | Exceptional 9.9% |
| Russians | 99.2 /100 | #39 | Exceptional 9.9% |
| Cypriots | 99.2 /100 | #40 | Exceptional 9.9% |
| Koreans | 99.2 /100 | #41 | Exceptional 9.9% |
| Immigrants | Iran | 99.1 /100 | #42 | Exceptional 9.9% |
| Immigrants | Moldova | 99.0 /100 | #43 | Exceptional 9.9% |
| Immigrants | Romania | 98.9 /100 | #44 | Exceptional 9.9% |
| Immigrants | Serbia | 98.9 /100 | #45 | Exceptional 10.0% |
| Turks | 98.9 /100 | #46 | Exceptional 10.0% |
| Immigrants | Singapore | 98.8 /100 | #47 | Exceptional 10.0% |
| Immigrants | Japan | 98.8 /100 | #48 | Exceptional 10.0% |