Guamanian/Chamorro vs Korean In Labor Force | Age 35-44
COMPARE
Guamanian/Chamorro
Korean
In Labor Force | Age 35-44
In Labor Force | Age 35-44 Comparison
Guamanians/Chamorros
Koreans
83.4%
IN LABOR FORCE | AGE 35-44
0.1/ 100
METRIC RATING
267th/ 347
METRIC RANK
84.3%
IN LABOR FORCE | AGE 35-44
36.3/ 100
METRIC RATING
182nd/ 347
METRIC RANK
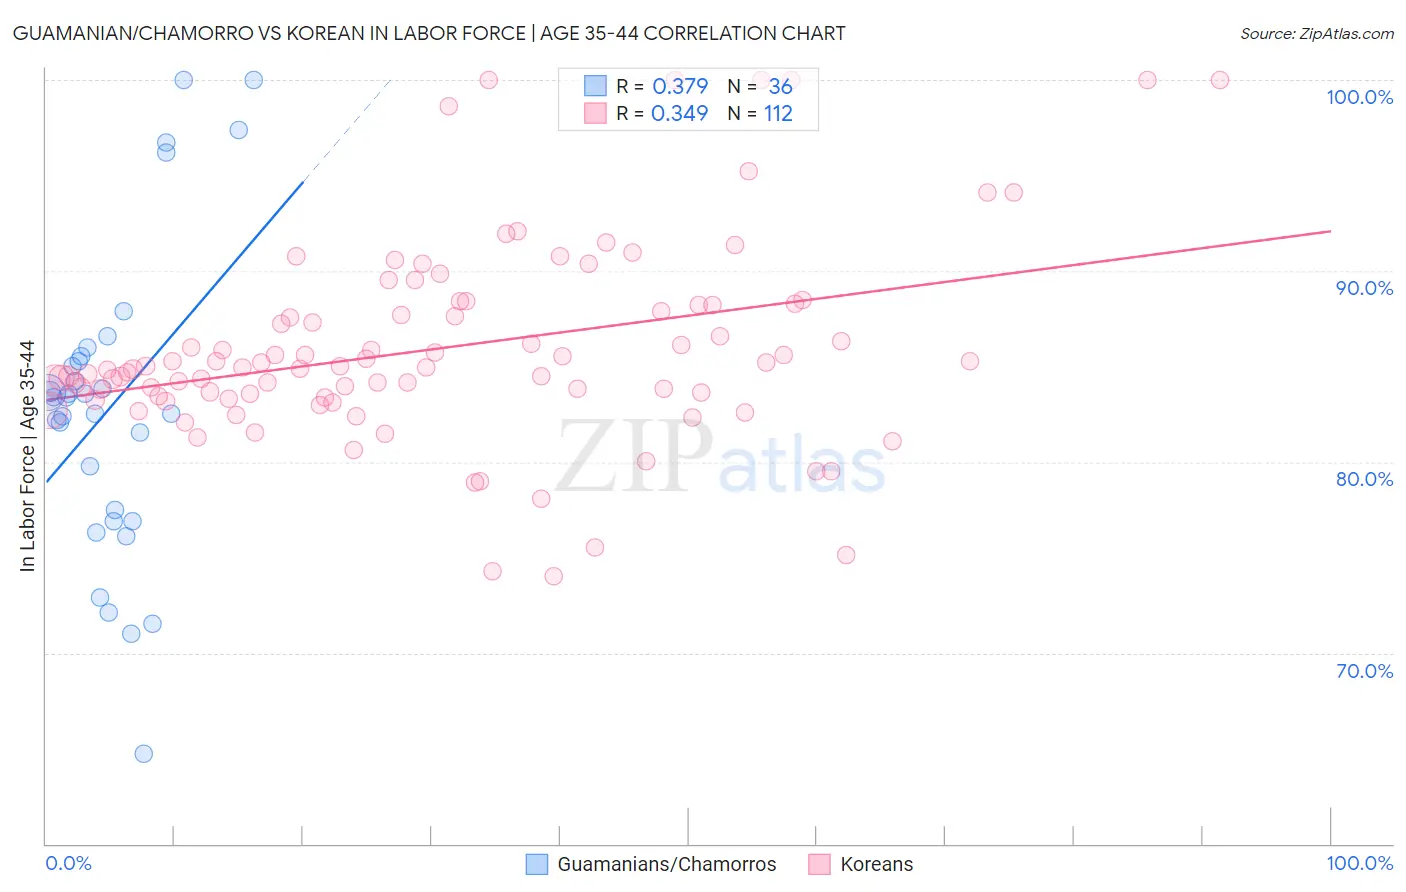
Guamanian/Chamorro vs Korean In Labor Force | Age 35-44 Correlation Chart
The statistical analysis conducted on geographies consisting of 221,926,114 people shows a mild positive correlation between the proportion of Guamanians/Chamorros and labor force participation rate among population between the ages 35 and 44 in the United States with a correlation coefficient (R) of 0.379 and weighted average of 83.4%. Similarly, the statistical analysis conducted on geographies consisting of 510,522,500 people shows a mild positive correlation between the proportion of Koreans and labor force participation rate among population between the ages 35 and 44 in the United States with a correlation coefficient (R) of 0.349 and weighted average of 84.3%, a difference of 1.1%.
In Labor Force | Age 35-44 Correlation Summary
| Measurement | Guamanian/Chamorro | Korean |
| Minimum | 64.7% | 74.0% |
| Maximum | 100.0% | 100.0% |
| Range | 35.3% | 26.0% |
| Mean | 82.9% | 86.0% |
| Median | 83.4% | 84.9% |
| Interquartile 25% (IQ1) | 77.2% | 83.4% |
| Interquartile 75% (IQ3) | 85.4% | 88.2% |
| Interquartile Range (IQR) | 8.2% | 4.8% |
| Standard Deviation (Sample) | 8.0% | 5.2% |
| Standard Deviation (Population) | 7.9% | 5.2% |
Similar Demographics by In Labor Force | Age 35-44
Demographics Similar to Guamanians/Chamorros by In Labor Force | Age 35-44
In terms of in labor force | age 35-44, the demographic groups most similar to Guamanians/Chamorros are Honduran (83.4%, a difference of 0.030%), Immigrants from Grenada (83.3%, a difference of 0.040%), Spaniard (83.4%, a difference of 0.050%), Central American (83.5%, a difference of 0.080%), and Scotch-Irish (83.5%, a difference of 0.090%).
| Demographics | Rating | Rank | In Labor Force | Age 35-44 |
| Vietnamese | 0.2 /100 | #260 | Tragic 83.5% |
| Immigrants | Dominica | 0.2 /100 | #261 | Tragic 83.5% |
| Immigrants | Congo | 0.2 /100 | #262 | Tragic 83.5% |
| Iroquois | 0.2 /100 | #263 | Tragic 83.5% |
| Scotch-Irish | 0.1 /100 | #264 | Tragic 83.5% |
| Central Americans | 0.1 /100 | #265 | Tragic 83.5% |
| Spaniards | 0.1 /100 | #266 | Tragic 83.4% |
| Guamanians/Chamorros | 0.1 /100 | #267 | Tragic 83.4% |
| Hondurans | 0.1 /100 | #268 | Tragic 83.4% |
| Immigrants | Grenada | 0.1 /100 | #269 | Tragic 83.3% |
| Immigrants | Honduras | 0.0 /100 | #270 | Tragic 83.3% |
| French American Indians | 0.0 /100 | #271 | Tragic 83.2% |
| Immigrants | Fiji | 0.0 /100 | #272 | Tragic 83.2% |
| Spanish | 0.0 /100 | #273 | Tragic 83.2% |
| Immigrants | Nonimmigrants | 0.0 /100 | #274 | Tragic 83.2% |
Demographics Similar to Koreans by In Labor Force | Age 35-44
In terms of in labor force | age 35-44, the demographic groups most similar to Koreans are Immigrants from West Indies (84.3%, a difference of 0.0%), Barbadian (84.3%, a difference of 0.0%), Armenian (84.3%, a difference of 0.010%), Costa Rican (84.3%, a difference of 0.010%), and Australian (84.3%, a difference of 0.010%).
| Demographics | Rating | Rank | In Labor Force | Age 35-44 |
| Pakistanis | 48.2 /100 | #175 | Average 84.4% |
| Sri Lankans | 47.3 /100 | #176 | Average 84.4% |
| French Canadians | 44.3 /100 | #177 | Average 84.3% |
| Northern Europeans | 44.1 /100 | #178 | Average 84.3% |
| Immigrants | South Africa | 42.8 /100 | #179 | Average 84.3% |
| Danes | 38.8 /100 | #180 | Fair 84.3% |
| Immigrants | West Indies | 36.4 /100 | #181 | Fair 84.3% |
| Koreans | 36.3 /100 | #182 | Fair 84.3% |
| Barbadians | 36.2 /100 | #183 | Fair 84.3% |
| Armenians | 35.6 /100 | #184 | Fair 84.3% |
| Costa Ricans | 35.3 /100 | #185 | Fair 84.3% |
| Australians | 35.1 /100 | #186 | Fair 84.3% |
| Dutch | 34.8 /100 | #187 | Fair 84.3% |
| South Africans | 34.1 /100 | #188 | Fair 84.3% |
| Immigrants | Denmark | 33.7 /100 | #189 | Fair 84.3% |