Tongan vs Korean Male Poverty
COMPARE
Tongan
Korean
Male Poverty
Male Poverty Comparison
Tongans
Koreans
9.7%
MALE POVERTY
99.5/ 100
METRIC RATING
31st/ 347
METRIC RANK
9.9%
MALE POVERTY
99.2/ 100
METRIC RATING
41st/ 347
METRIC RANK
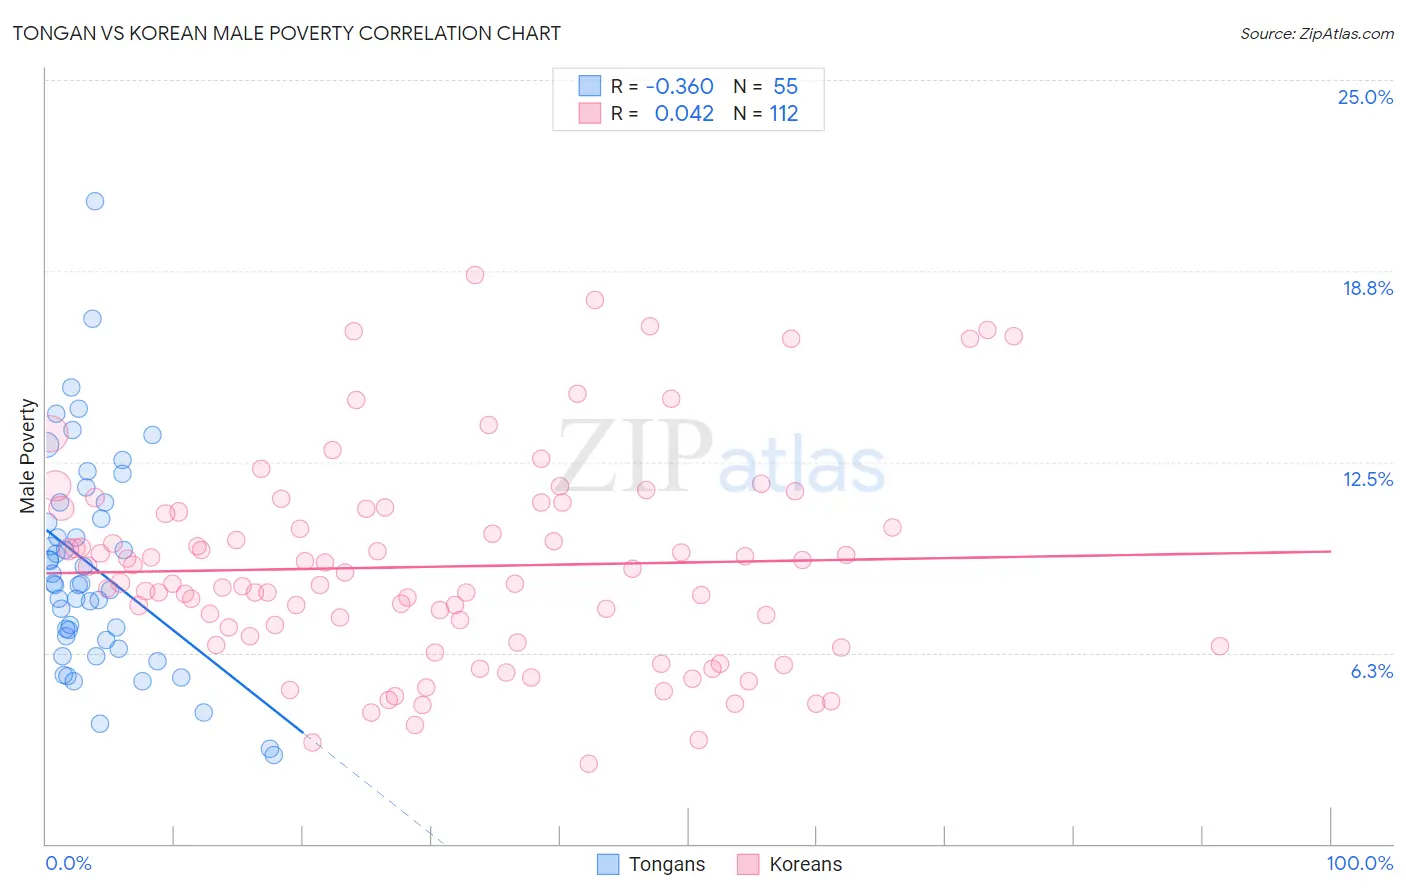
Tongan vs Korean Male Poverty Correlation Chart
The statistical analysis conducted on geographies consisting of 102,857,132 people shows a mild negative correlation between the proportion of Tongans and poverty level among males in the United States with a correlation coefficient (R) of -0.360 and weighted average of 9.7%. Similarly, the statistical analysis conducted on geographies consisting of 510,064,453 people shows no correlation between the proportion of Koreans and poverty level among males in the United States with a correlation coefficient (R) of 0.042 and weighted average of 9.9%, a difference of 1.6%.
Male Poverty Correlation Summary
| Measurement | Tongan | Korean |
| Minimum | 2.9% | 2.6% |
| Maximum | 21.0% | 18.6% |
| Range | 18.2% | 16.0% |
| Mean | 9.1% | 9.1% |
| Median | 8.5% | 8.5% |
| Interquartile 25% (IQ1) | 6.7% | 6.7% |
| Interquartile 75% (IQ3) | 11.2% | 10.9% |
| Interquartile Range (IQR) | 4.5% | 4.2% |
| Standard Deviation (Sample) | 3.5% | 3.4% |
| Standard Deviation (Population) | 3.5% | 3.4% |
Demographics Similar to Tongans and Koreans by Male Poverty
In terms of male poverty, the demographic groups most similar to Tongans are Polish (9.7%, a difference of 0.020%), Greek (9.7%, a difference of 0.10%), Immigrants from Korea (9.7%, a difference of 0.14%), Macedonian (9.7%, a difference of 0.21%), and Danish (9.7%, a difference of 0.22%). Similarly, the demographic groups most similar to Koreans are Cypriot (9.9%, a difference of 0.10%), Russian (9.9%, a difference of 0.17%), Immigrants from Pakistan (9.9%, a difference of 0.18%), Immigrants from Iran (9.9%, a difference of 0.24%), and Immigrants from Moldova (9.9%, a difference of 0.50%).
| Demographics | Rating | Rank | Male Poverty |
| Burmese | 99.6 /100 | #26 | Exceptional 9.7% |
| Danes | 99.6 /100 | #27 | Exceptional 9.7% |
| Immigrants | Korea | 99.6 /100 | #28 | Exceptional 9.7% |
| Greeks | 99.6 /100 | #29 | Exceptional 9.7% |
| Poles | 99.5 /100 | #30 | Exceptional 9.7% |
| Tongans | 99.5 /100 | #31 | Exceptional 9.7% |
| Macedonians | 99.5 /100 | #32 | Exceptional 9.7% |
| Immigrants | Northern Europe | 99.5 /100 | #33 | Exceptional 9.7% |
| Immigrants | Poland | 99.5 /100 | #34 | Exceptional 9.8% |
| Iranians | 99.4 /100 | #35 | Exceptional 9.8% |
| Czechs | 99.4 /100 | #36 | Exceptional 9.8% |
| Immigrants | Greece | 99.3 /100 | #37 | Exceptional 9.8% |
| Immigrants | Pakistan | 99.2 /100 | #38 | Exceptional 9.9% |
| Russians | 99.2 /100 | #39 | Exceptional 9.9% |
| Cypriots | 99.2 /100 | #40 | Exceptional 9.9% |
| Koreans | 99.2 /100 | #41 | Exceptional 9.9% |
| Immigrants | Iran | 99.1 /100 | #42 | Exceptional 9.9% |
| Immigrants | Moldova | 99.0 /100 | #43 | Exceptional 9.9% |
| Immigrants | Romania | 98.9 /100 | #44 | Exceptional 9.9% |
| Immigrants | Serbia | 98.9 /100 | #45 | Exceptional 10.0% |
| Turks | 98.9 /100 | #46 | Exceptional 10.0% |