Guamanian/Chamorro vs Basque Single Father Poverty
COMPARE
Guamanian/Chamorro
Basque
Single Father Poverty
Single Father Poverty Comparison
Guamanians/Chamorros
Basques
15.1%
SINGLE FATHER POVERTY
99.9/ 100
METRIC RATING
59th/ 347
METRIC RANK
15.5%
SINGLE FATHER POVERTY
98.4/ 100
METRIC RATING
93rd/ 347
METRIC RANK
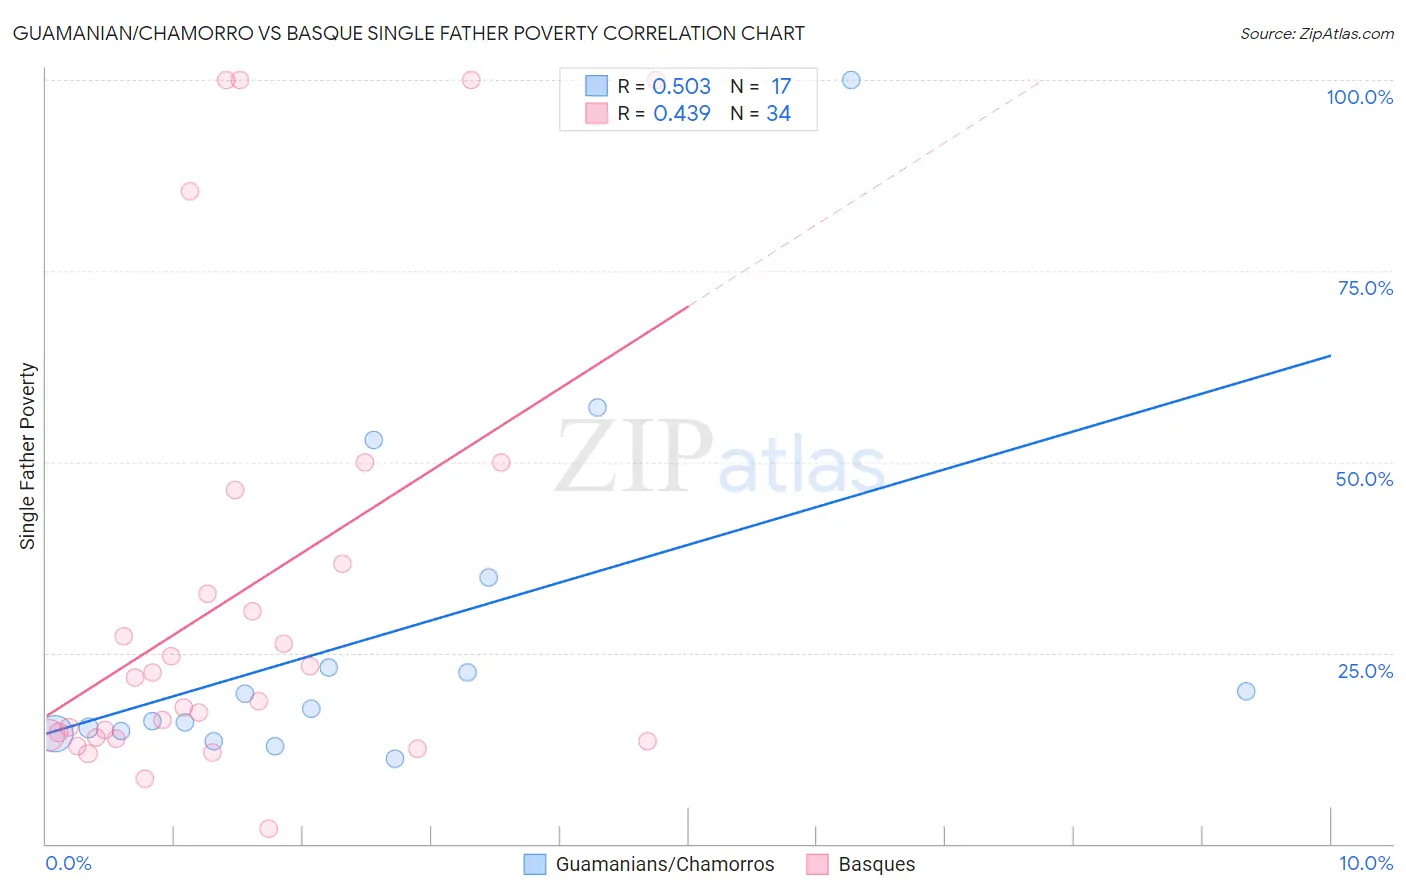
Guamanian/Chamorro vs Basque Single Father Poverty Correlation Chart
The statistical analysis conducted on geographies consisting of 191,371,634 people shows a substantial positive correlation between the proportion of Guamanians/Chamorros and poverty level among single fathers in the United States with a correlation coefficient (R) of 0.503 and weighted average of 15.1%. Similarly, the statistical analysis conducted on geographies consisting of 144,984,159 people shows a moderate positive correlation between the proportion of Basques and poverty level among single fathers in the United States with a correlation coefficient (R) of 0.439 and weighted average of 15.5%, a difference of 3.0%.
Single Father Poverty Correlation Summary
| Measurement | Guamanian/Chamorro | Basque |
| Minimum | 11.2% | 2.0% |
| Maximum | 100.0% | 100.0% |
| Range | 88.8% | 98.0% |
| Mean | 27.1% | 32.5% |
| Median | 17.6% | 20.2% |
| Interquartile 25% (IQ1) | 14.6% | 13.9% |
| Interquartile 75% (IQ3) | 29.0% | 36.7% |
| Interquartile Range (IQR) | 14.4% | 22.8% |
| Standard Deviation (Sample) | 23.1% | 29.5% |
| Standard Deviation (Population) | 22.4% | 29.0% |
Similar Demographics by Single Father Poverty
Demographics Similar to Guamanians/Chamorros by Single Father Poverty
In terms of single father poverty, the demographic groups most similar to Guamanians/Chamorros are Hawaiian (15.1%, a difference of 0.10%), Laotian (15.1%, a difference of 0.15%), Immigrants from Laos (15.1%, a difference of 0.24%), Puget Sound Salish (15.2%, a difference of 0.40%), and Immigrants from Bosnia and Herzegovina (15.2%, a difference of 0.45%).
| Demographics | Rating | Rank | Single Father Poverty |
| Immigrants | El Salvador | 99.9 /100 | #52 | Exceptional 15.0% |
| Immigrants | Kenya | 99.9 /100 | #53 | Exceptional 15.0% |
| Immigrants | Uzbekistan | 99.9 /100 | #54 | Exceptional 15.0% |
| Immigrants | Bulgaria | 99.9 /100 | #55 | Exceptional 15.0% |
| Immigrants | Laos | 99.9 /100 | #56 | Exceptional 15.1% |
| Laotians | 99.9 /100 | #57 | Exceptional 15.1% |
| Hawaiians | 99.9 /100 | #58 | Exceptional 15.1% |
| Guamanians/Chamorros | 99.9 /100 | #59 | Exceptional 15.1% |
| Puget Sound Salish | 99.8 /100 | #60 | Exceptional 15.2% |
| Immigrants | Bosnia and Herzegovina | 99.8 /100 | #61 | Exceptional 15.2% |
| Immigrants | Armenia | 99.8 /100 | #62 | Exceptional 15.2% |
| Immigrants | Sweden | 99.8 /100 | #63 | Exceptional 15.2% |
| Bangladeshis | 99.8 /100 | #64 | Exceptional 15.2% |
| Immigrants | Malaysia | 99.8 /100 | #65 | Exceptional 15.2% |
| Immigrants | Moldova | 99.8 /100 | #66 | Exceptional 15.2% |
Demographics Similar to Basques by Single Father Poverty
In terms of single father poverty, the demographic groups most similar to Basques are Immigrants from Serbia (15.5%, a difference of 0.040%), Immigrants from Uruguay (15.6%, a difference of 0.14%), Immigrants from Romania (15.5%, a difference of 0.15%), Immigrants from Kazakhstan (15.6%, a difference of 0.19%), and Immigrants from Belgium (15.6%, a difference of 0.20%).
| Demographics | Rating | Rank | Single Father Poverty |
| Immigrants | Russia | 99.0 /100 | #86 | Exceptional 15.5% |
| Brazilians | 99.0 /100 | #87 | Exceptional 15.5% |
| Burmese | 99.0 /100 | #88 | Exceptional 15.5% |
| Immigrants | Korea | 99.0 /100 | #89 | Exceptional 15.5% |
| Mexican American Indians | 98.7 /100 | #90 | Exceptional 15.5% |
| Immigrants | Romania | 98.6 /100 | #91 | Exceptional 15.5% |
| Immigrants | Serbia | 98.5 /100 | #92 | Exceptional 15.5% |
| Basques | 98.4 /100 | #93 | Exceptional 15.5% |
| Immigrants | Uruguay | 98.2 /100 | #94 | Exceptional 15.6% |
| Immigrants | Kazakhstan | 98.2 /100 | #95 | Exceptional 15.6% |
| Immigrants | Belgium | 98.1 /100 | #96 | Exceptional 15.6% |
| Yaqui | 98.1 /100 | #97 | Exceptional 15.6% |
| Zimbabweans | 98.1 /100 | #98 | Exceptional 15.6% |
| Immigrants | Middle Africa | 97.4 /100 | #99 | Exceptional 15.6% |
| Immigrants | Chile | 96.9 /100 | #100 | Exceptional 15.7% |