Immigrants from Zimbabwe vs Latvian Child Poverty Under the Age of 16
COMPARE
Immigrants from Zimbabwe
Latvian
Child Poverty Under the Age of 16
Child Poverty Under the Age of 16 Comparison
Immigrants from Zimbabwe
Latvians
15.0%
CHILD POVERTY UNDER THE AGE OF 16
92.1/ 100
METRIC RATING
121st/ 347
METRIC RANK
13.2%
CHILD POVERTY UNDER THE AGE OF 16
99.8/ 100
METRIC RATING
24th/ 347
METRIC RANK
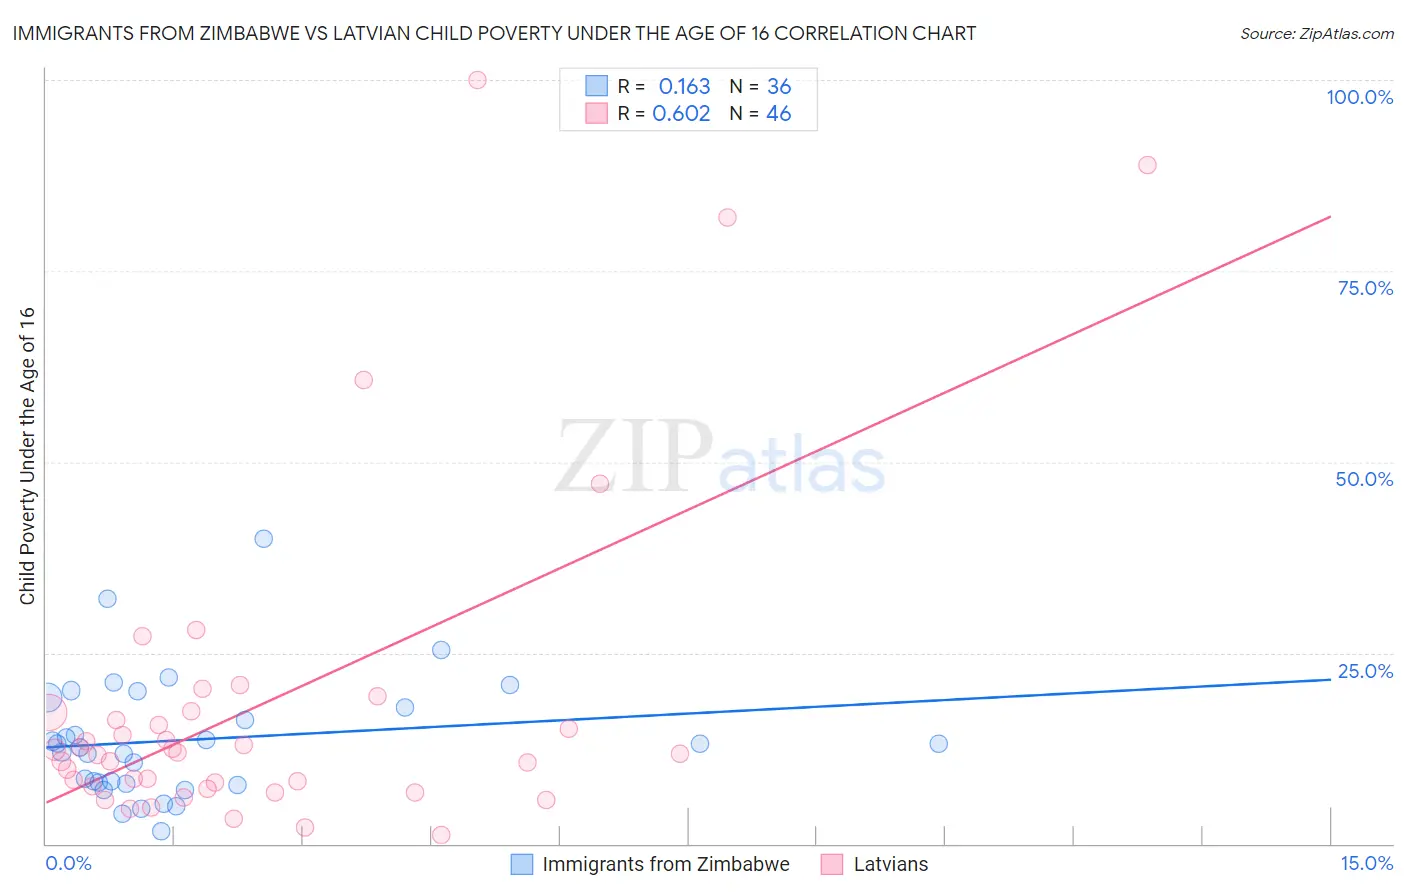
Immigrants from Zimbabwe vs Latvian Child Poverty Under the Age of 16 Correlation Chart
The statistical analysis conducted on geographies consisting of 117,606,352 people shows a poor positive correlation between the proportion of Immigrants from Zimbabwe and poverty level among children under the age of 16 in the United States with a correlation coefficient (R) of 0.163 and weighted average of 15.0%. Similarly, the statistical analysis conducted on geographies consisting of 218,902,894 people shows a significant positive correlation between the proportion of Latvians and poverty level among children under the age of 16 in the United States with a correlation coefficient (R) of 0.602 and weighted average of 13.2%, a difference of 13.9%.
Child Poverty Under the Age of 16 Correlation Summary
| Measurement | Immigrants from Zimbabwe | Latvian |
| Minimum | 1.7% | 1.1% |
| Maximum | 40.0% | 100.0% |
| Range | 38.3% | 98.9% |
| Mean | 13.6% | 18.4% |
| Median | 12.9% | 11.8% |
| Interquartile 25% (IQ1) | 8.0% | 7.5% |
| Interquartile 75% (IQ3) | 18.5% | 17.3% |
| Interquartile Range (IQR) | 10.5% | 9.7% |
| Standard Deviation (Sample) | 8.0% | 22.0% |
| Standard Deviation (Population) | 7.9% | 21.7% |
Similar Demographics by Child Poverty Under the Age of 16
Demographics Similar to Immigrants from Zimbabwe by Child Poverty Under the Age of 16
In terms of child poverty under the age of 16, the demographic groups most similar to Immigrants from Zimbabwe are South African (15.0%, a difference of 0.010%), Scottish (15.0%, a difference of 0.090%), Pakistani (15.0%, a difference of 0.20%), Immigrants from Malaysia (15.0%, a difference of 0.25%), and Immigrants from Norway (15.0%, a difference of 0.30%).
| Demographics | Rating | Rank | Child Poverty Under the Age of 16 |
| Sri Lankans | 93.2 /100 | #114 | Exceptional 14.9% |
| Immigrants | Ukraine | 93.1 /100 | #115 | Exceptional 14.9% |
| Carpatho Rusyns | 93.1 /100 | #116 | Exceptional 14.9% |
| Immigrants | Norway | 92.8 /100 | #117 | Exceptional 15.0% |
| Immigrants | Malaysia | 92.6 /100 | #118 | Exceptional 15.0% |
| Scottish | 92.3 /100 | #119 | Exceptional 15.0% |
| South Africans | 92.1 /100 | #120 | Exceptional 15.0% |
| Immigrants | Zimbabwe | 92.1 /100 | #121 | Exceptional 15.0% |
| Pakistanis | 91.7 /100 | #122 | Exceptional 15.0% |
| Immigrants | Brazil | 91.1 /100 | #123 | Exceptional 15.1% |
| Czechoslovakians | 91.0 /100 | #124 | Exceptional 15.1% |
| Palestinians | 90.9 /100 | #125 | Exceptional 15.1% |
| Portuguese | 90.6 /100 | #126 | Exceptional 15.1% |
| Immigrants | Western Europe | 90.3 /100 | #127 | Exceptional 15.1% |
| Immigrants | Kazakhstan | 90.2 /100 | #128 | Exceptional 15.1% |
Demographics Similar to Latvians by Child Poverty Under the Age of 16
In terms of child poverty under the age of 16, the demographic groups most similar to Latvians are Eastern European (13.2%, a difference of 0.080%), Indian (Asian) (13.1%, a difference of 0.21%), Maltese (13.1%, a difference of 0.25%), Immigrants from Eastern Asia (13.1%, a difference of 0.33%), and Okinawan (13.1%, a difference of 0.36%).
| Demographics | Rating | Rank | Child Poverty Under the Age of 16 |
| Bulgarians | 99.9 /100 | #17 | Exceptional 13.0% |
| Cypriots | 99.9 /100 | #18 | Exceptional 13.0% |
| Immigrants | Japan | 99.8 /100 | #19 | Exceptional 13.0% |
| Okinawans | 99.8 /100 | #20 | Exceptional 13.1% |
| Immigrants | Eastern Asia | 99.8 /100 | #21 | Exceptional 13.1% |
| Maltese | 99.8 /100 | #22 | Exceptional 13.1% |
| Indians (Asian) | 99.8 /100 | #23 | Exceptional 13.1% |
| Latvians | 99.8 /100 | #24 | Exceptional 13.2% |
| Eastern Europeans | 99.8 /100 | #25 | Exceptional 13.2% |
| Bolivians | 99.8 /100 | #26 | Exceptional 13.2% |
| Immigrants | China | 99.8 /100 | #27 | Exceptional 13.3% |
| Assyrians/Chaldeans/Syriacs | 99.7 /100 | #28 | Exceptional 13.3% |
| Swedes | 99.7 /100 | #29 | Exceptional 13.3% |
| Turks | 99.7 /100 | #30 | Exceptional 13.4% |
| Danes | 99.7 /100 | #31 | Exceptional 13.4% |