Cajun vs Latvian Child Poverty Under the Age of 16
COMPARE
Cajun
Latvian
Child Poverty Under the Age of 16
Child Poverty Under the Age of 16 Comparison
Cajuns
Latvians
22.1%
CHILD POVERTY UNDER THE AGE OF 16
0.0/ 100
METRIC RATING
320th/ 347
METRIC RANK
13.2%
CHILD POVERTY UNDER THE AGE OF 16
99.8/ 100
METRIC RATING
24th/ 347
METRIC RANK
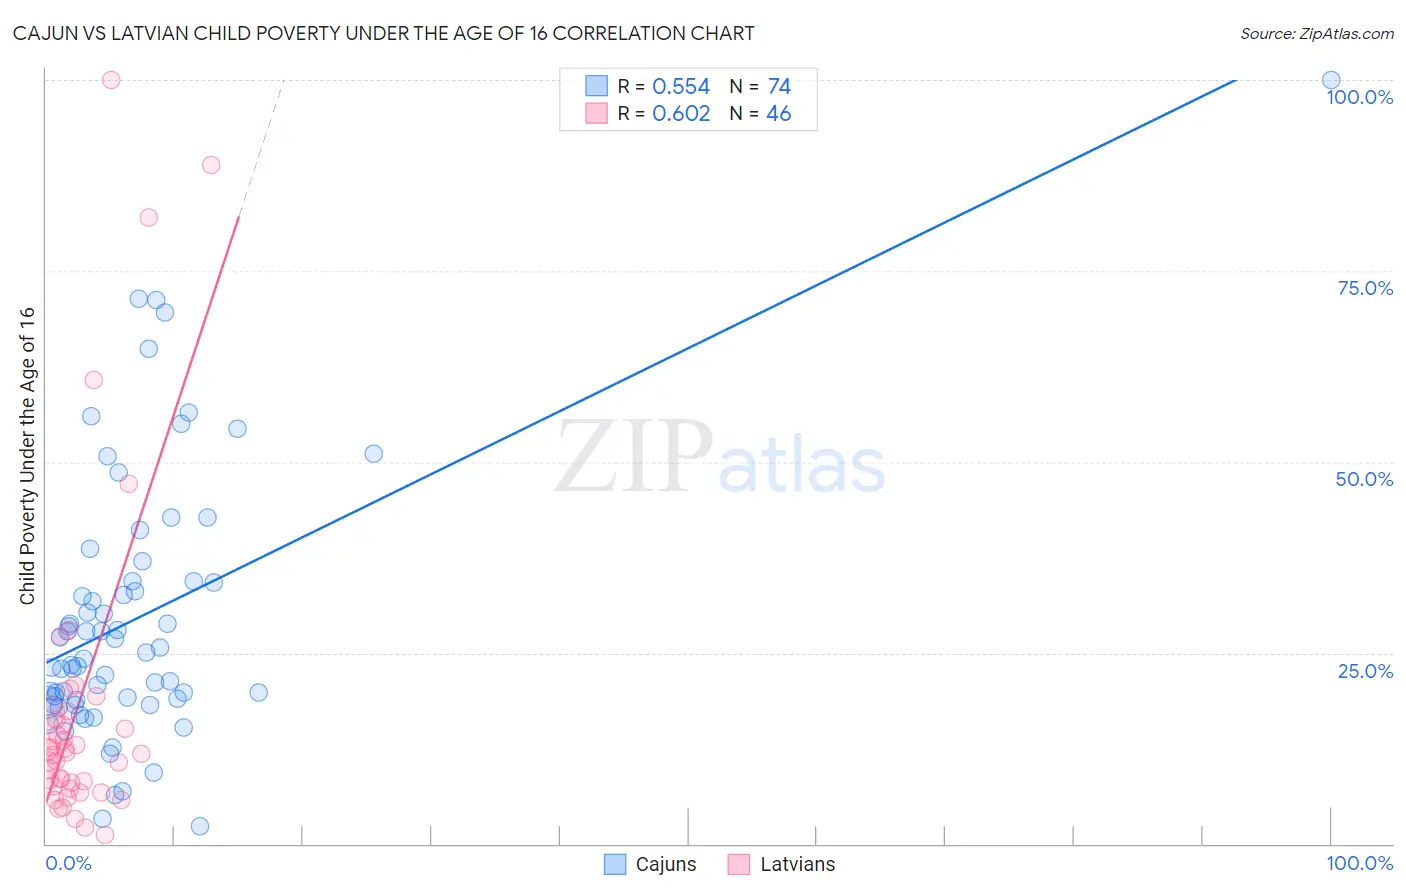
Cajun vs Latvian Child Poverty Under the Age of 16 Correlation Chart
The statistical analysis conducted on geographies consisting of 149,200,833 people shows a substantial positive correlation between the proportion of Cajuns and poverty level among children under the age of 16 in the United States with a correlation coefficient (R) of 0.554 and weighted average of 22.1%. Similarly, the statistical analysis conducted on geographies consisting of 218,902,894 people shows a significant positive correlation between the proportion of Latvians and poverty level among children under the age of 16 in the United States with a correlation coefficient (R) of 0.602 and weighted average of 13.2%, a difference of 67.9%.
Child Poverty Under the Age of 16 Correlation Summary
| Measurement | Cajun | Latvian |
| Minimum | 2.4% | 1.1% |
| Maximum | 100.0% | 100.0% |
| Range | 97.6% | 98.9% |
| Mean | 29.5% | 18.4% |
| Median | 24.6% | 11.8% |
| Interquartile 25% (IQ1) | 18.9% | 7.5% |
| Interquartile 75% (IQ3) | 34.3% | 17.3% |
| Interquartile Range (IQR) | 15.4% | 9.7% |
| Standard Deviation (Sample) | 17.6% | 22.0% |
| Standard Deviation (Population) | 17.5% | 21.7% |
Similar Demographics by Child Poverty Under the Age of 16
Demographics Similar to Cajuns by Child Poverty Under the Age of 16
In terms of child poverty under the age of 16, the demographic groups most similar to Cajuns are Kiowa (22.2%, a difference of 0.19%), Yakama (22.1%, a difference of 0.20%), Honduran (22.2%, a difference of 0.37%), U.S. Virgin Islander (22.0%, a difference of 0.71%), and Immigrants from Dominica (21.9%, a difference of 1.1%).
| Demographics | Rating | Rank | Child Poverty Under the Age of 16 |
| Creek | 0.0 /100 | #313 | Tragic 21.5% |
| Immigrants | Somalia | 0.0 /100 | #314 | Tragic 21.6% |
| Immigrants | Guatemala | 0.0 /100 | #315 | Tragic 21.6% |
| Africans | 0.0 /100 | #316 | Tragic 21.7% |
| Immigrants | Dominica | 0.0 /100 | #317 | Tragic 21.9% |
| U.S. Virgin Islanders | 0.0 /100 | #318 | Tragic 22.0% |
| Yakama | 0.0 /100 | #319 | Tragic 22.1% |
| Cajuns | 0.0 /100 | #320 | Tragic 22.1% |
| Kiowa | 0.0 /100 | #321 | Tragic 22.2% |
| Hondurans | 0.0 /100 | #322 | Tragic 22.2% |
| Paiute | 0.0 /100 | #323 | Tragic 22.4% |
| Central American Indians | 0.0 /100 | #324 | Tragic 22.5% |
| Immigrants | Congo | 0.0 /100 | #325 | Tragic 22.5% |
| Immigrants | Honduras | 0.0 /100 | #326 | Tragic 22.7% |
| Menominee | 0.0 /100 | #327 | Tragic 23.0% |
Demographics Similar to Latvians by Child Poverty Under the Age of 16
In terms of child poverty under the age of 16, the demographic groups most similar to Latvians are Eastern European (13.2%, a difference of 0.080%), Indian (Asian) (13.1%, a difference of 0.21%), Maltese (13.1%, a difference of 0.25%), Immigrants from Eastern Asia (13.1%, a difference of 0.33%), and Okinawan (13.1%, a difference of 0.36%).
| Demographics | Rating | Rank | Child Poverty Under the Age of 16 |
| Bulgarians | 99.9 /100 | #17 | Exceptional 13.0% |
| Cypriots | 99.9 /100 | #18 | Exceptional 13.0% |
| Immigrants | Japan | 99.8 /100 | #19 | Exceptional 13.0% |
| Okinawans | 99.8 /100 | #20 | Exceptional 13.1% |
| Immigrants | Eastern Asia | 99.8 /100 | #21 | Exceptional 13.1% |
| Maltese | 99.8 /100 | #22 | Exceptional 13.1% |
| Indians (Asian) | 99.8 /100 | #23 | Exceptional 13.1% |
| Latvians | 99.8 /100 | #24 | Exceptional 13.2% |
| Eastern Europeans | 99.8 /100 | #25 | Exceptional 13.2% |
| Bolivians | 99.8 /100 | #26 | Exceptional 13.2% |
| Immigrants | China | 99.8 /100 | #27 | Exceptional 13.3% |
| Assyrians/Chaldeans/Syriacs | 99.7 /100 | #28 | Exceptional 13.3% |
| Swedes | 99.7 /100 | #29 | Exceptional 13.3% |
| Turks | 99.7 /100 | #30 | Exceptional 13.4% |
| Danes | 99.7 /100 | #31 | Exceptional 13.4% |