Immigrants from Somalia vs Indonesian Male Poverty
COMPARE
Immigrants from Somalia
Indonesian
Male Poverty
Male Poverty Comparison
Immigrants from Somalia
Indonesians
14.6%
MALE POVERTY
0.0/ 100
METRIC RATING
313th/ 347
METRIC RANK
13.8%
MALE POVERTY
0.0/ 100
METRIC RATING
292nd/ 347
METRIC RANK
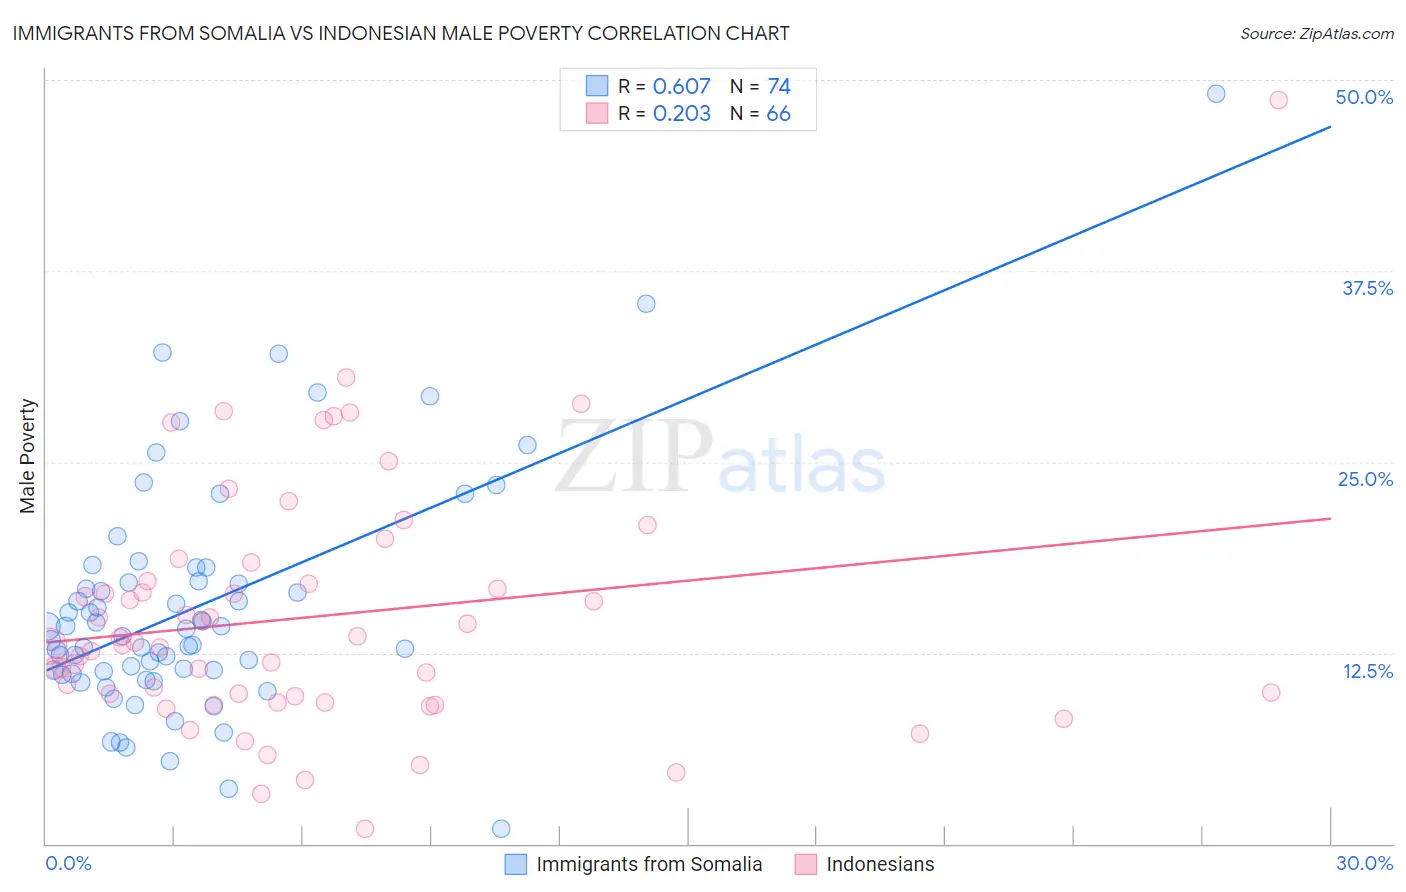
Immigrants from Somalia vs Indonesian Male Poverty Correlation Chart
The statistical analysis conducted on geographies consisting of 92,092,836 people shows a significant positive correlation between the proportion of Immigrants from Somalia and poverty level among males in the United States with a correlation coefficient (R) of 0.607 and weighted average of 14.6%. Similarly, the statistical analysis conducted on geographies consisting of 162,645,449 people shows a weak positive correlation between the proportion of Indonesians and poverty level among males in the United States with a correlation coefficient (R) of 0.203 and weighted average of 13.8%, a difference of 5.3%.
Male Poverty Correlation Summary
| Measurement | Immigrants from Somalia | Indonesian |
| Minimum | 1.0% | 1.0% |
| Maximum | 49.1% | 48.7% |
| Range | 48.1% | 47.6% |
| Mean | 15.5% | 14.9% |
| Median | 13.8% | 13.1% |
| Interquartile 25% (IQ1) | 11.3% | 9.6% |
| Interquartile 75% (IQ3) | 17.2% | 17.2% |
| Interquartile Range (IQR) | 5.9% | 7.5% |
| Standard Deviation (Sample) | 7.8% | 8.0% |
| Standard Deviation (Population) | 7.7% | 8.0% |
Similar Demographics by Male Poverty
Demographics Similar to Immigrants from Somalia by Male Poverty
In terms of male poverty, the demographic groups most similar to Immigrants from Somalia are Immigrants from Honduras (14.6%, a difference of 0.040%), Chippewa (14.6%, a difference of 0.11%), British West Indian (14.6%, a difference of 0.14%), Immigrants from Dominica (14.7%, a difference of 0.82%), and Immigrants from Grenada (14.7%, a difference of 0.87%).
| Demographics | Rating | Rank | Male Poverty |
| Creek | 0.0 /100 | #306 | Tragic 14.1% |
| Dutch West Indians | 0.0 /100 | #307 | Tragic 14.2% |
| Africans | 0.0 /100 | #308 | Tragic 14.2% |
| Somalis | 0.0 /100 | #309 | Tragic 14.3% |
| Seminole | 0.0 /100 | #310 | Tragic 14.3% |
| Hondurans | 0.0 /100 | #311 | Tragic 14.3% |
| Choctaw | 0.0 /100 | #312 | Tragic 14.4% |
| Immigrants | Somalia | 0.0 /100 | #313 | Tragic 14.6% |
| Immigrants | Honduras | 0.0 /100 | #314 | Tragic 14.6% |
| Chippewa | 0.0 /100 | #315 | Tragic 14.6% |
| British West Indians | 0.0 /100 | #316 | Tragic 14.6% |
| Immigrants | Dominica | 0.0 /100 | #317 | Tragic 14.7% |
| Immigrants | Grenada | 0.0 /100 | #318 | Tragic 14.7% |
| U.S. Virgin Islanders | 0.0 /100 | #319 | Tragic 14.7% |
| Immigrants | Congo | 0.0 /100 | #320 | Tragic 14.7% |
Demographics Similar to Indonesians by Male Poverty
In terms of male poverty, the demographic groups most similar to Indonesians are Immigrants from Belize (13.8%, a difference of 0.010%), Hispanic or Latino (13.9%, a difference of 0.070%), Vietnamese (13.8%, a difference of 0.17%), Guatemalan (13.8%, a difference of 0.26%), and Immigrants from Zaire (13.8%, a difference of 0.26%).
| Demographics | Rating | Rank | Male Poverty |
| West Indians | 0.0 /100 | #285 | Tragic 13.8% |
| Shoshone | 0.0 /100 | #286 | Tragic 13.8% |
| Immigrants | Barbados | 0.0 /100 | #287 | Tragic 13.8% |
| Immigrants | St. Vincent and the Grenadines | 0.0 /100 | #288 | Tragic 13.8% |
| Guatemalans | 0.0 /100 | #289 | Tragic 13.8% |
| Immigrants | Zaire | 0.0 /100 | #290 | Tragic 13.8% |
| Vietnamese | 0.0 /100 | #291 | Tragic 13.8% |
| Indonesians | 0.0 /100 | #292 | Tragic 13.8% |
| Immigrants | Belize | 0.0 /100 | #293 | Tragic 13.8% |
| Hispanics or Latinos | 0.0 /100 | #294 | Tragic 13.9% |
| Immigrants | Central America | 0.0 /100 | #295 | Tragic 13.9% |
| Cajuns | 0.0 /100 | #296 | Tragic 13.9% |
| Inupiat | 0.0 /100 | #297 | Tragic 14.0% |
| Blackfeet | 0.0 /100 | #298 | Tragic 14.0% |
| Immigrants | Guatemala | 0.0 /100 | #299 | Tragic 14.0% |