German Russian vs Indonesian Unemployment Among Women with Children Under 18 years
COMPARE
German Russian
Indonesian
Unemployment Among Women with Children Under 18 years
Unemployment Among Women with Children Under 18 years Comparison
German Russians
Indonesians
5.4%
UNEMPLOYMENT AMONG WOMEN WITH CHILDREN UNDER 18 YEARS
70.2/ 100
METRIC RATING
157th/ 347
METRIC RANK
5.5%
UNEMPLOYMENT AMONG WOMEN WITH CHILDREN UNDER 18 YEARS
36.3/ 100
METRIC RATING
186th/ 347
METRIC RANK
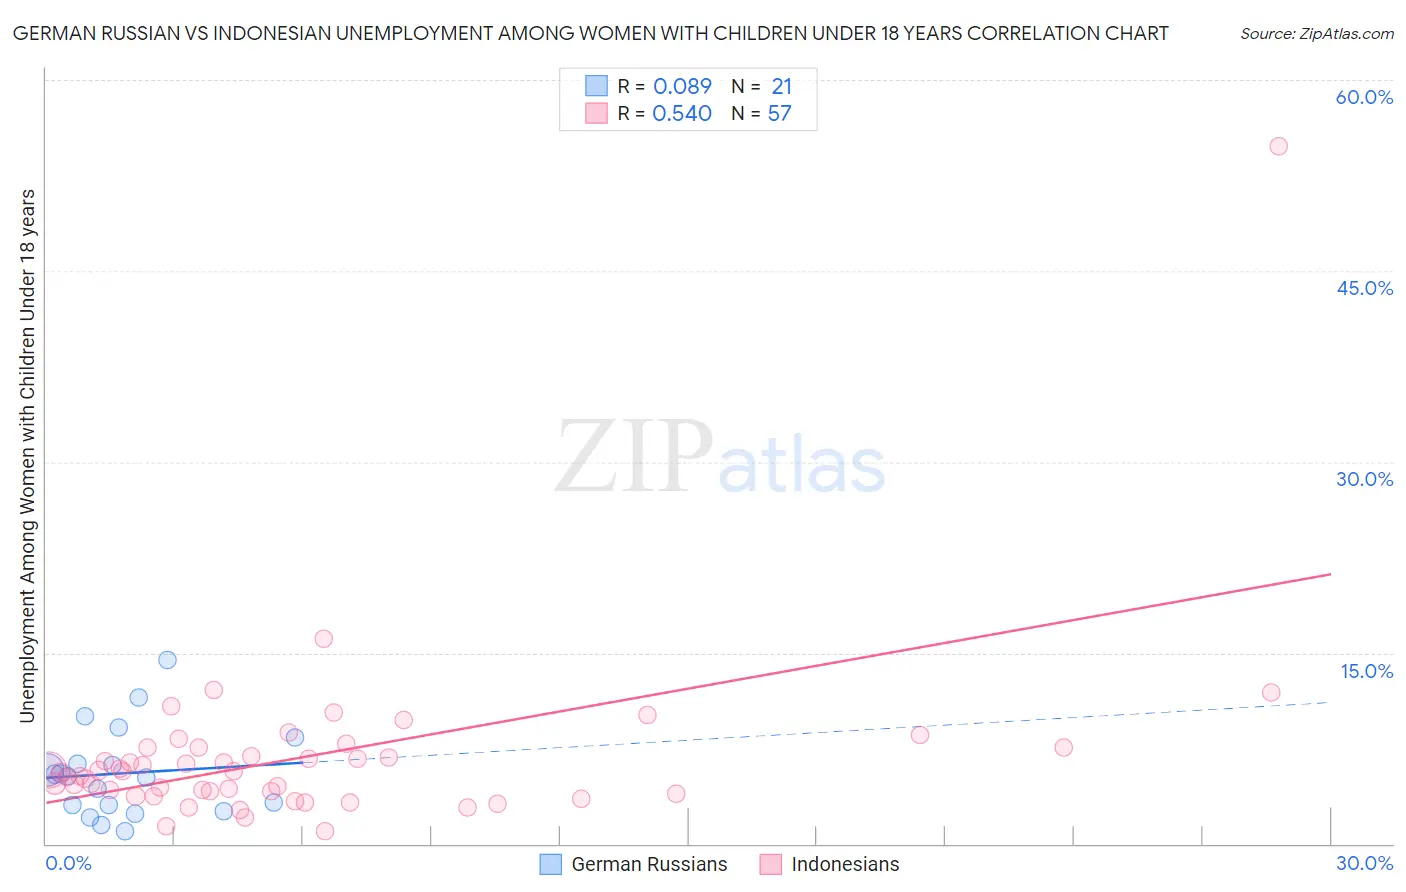
German Russian vs Indonesian Unemployment Among Women with Children Under 18 years Correlation Chart
The statistical analysis conducted on geographies consisting of 94,995,777 people shows a slight positive correlation between the proportion of German Russians and unemployment rate among women with children under the age of 18 in the United States with a correlation coefficient (R) of 0.089 and weighted average of 5.4%. Similarly, the statistical analysis conducted on geographies consisting of 160,707,553 people shows a substantial positive correlation between the proportion of Indonesians and unemployment rate among women with children under the age of 18 in the United States with a correlation coefficient (R) of 0.540 and weighted average of 5.5%, a difference of 2.6%.
Unemployment Among Women with Children Under 18 years Correlation Summary
| Measurement | German Russian | Indonesian |
| Minimum | 0.98% | 1.0% |
| Maximum | 14.5% | 54.8% |
| Range | 13.5% | 53.8% |
| Mean | 5.5% | 6.8% |
| Median | 5.3% | 5.7% |
| Interquartile 25% (IQ1) | 2.8% | 4.0% |
| Interquartile 75% (IQ3) | 7.3% | 7.6% |
| Interquartile Range (IQR) | 4.5% | 3.6% |
| Standard Deviation (Sample) | 3.5% | 7.1% |
| Standard Deviation (Population) | 3.4% | 7.0% |
Similar Demographics by Unemployment Among Women with Children Under 18 years
Demographics Similar to German Russians by Unemployment Among Women with Children Under 18 years
In terms of unemployment among women with children under 18 years, the demographic groups most similar to German Russians are South African (5.4%, a difference of 0.010%), Korean (5.4%, a difference of 0.030%), Carpatho Rusyn (5.4%, a difference of 0.050%), Immigrants from Latvia (5.4%, a difference of 0.050%), and Immigrants from Burma/Myanmar (5.4%, a difference of 0.060%).
| Demographics | Rating | Rank | Unemployment Among Women with Children Under 18 years |
| Immigrants | Argentina | 71.7 /100 | #150 | Good 5.4% |
| Immigrants | Iran | 71.1 /100 | #151 | Good 5.4% |
| Immigrants | South Eastern Asia | 71.1 /100 | #152 | Good 5.4% |
| Carpatho Rusyns | 70.8 /100 | #153 | Good 5.4% |
| Immigrants | Latvia | 70.8 /100 | #154 | Good 5.4% |
| Koreans | 70.5 /100 | #155 | Good 5.4% |
| South Africans | 70.3 /100 | #156 | Good 5.4% |
| German Russians | 70.2 /100 | #157 | Good 5.4% |
| Immigrants | Burma/Myanmar | 69.5 /100 | #158 | Good 5.4% |
| Chickasaw | 68.4 /100 | #159 | Good 5.4% |
| Afghans | 66.6 /100 | #160 | Good 5.4% |
| Immigrants | Iraq | 65.9 /100 | #161 | Good 5.4% |
| Immigrants | Saudi Arabia | 65.0 /100 | #162 | Good 5.4% |
| Lebanese | 64.7 /100 | #163 | Good 5.4% |
| Celtics | 63.0 /100 | #164 | Good 5.4% |
Demographics Similar to Indonesians by Unemployment Among Women with Children Under 18 years
In terms of unemployment among women with children under 18 years, the demographic groups most similar to Indonesians are Malaysian (5.5%, a difference of 0.050%), Iraqi (5.5%, a difference of 0.080%), Immigrants from Zaire (5.5%, a difference of 0.13%), Immigrants from Cambodia (5.5%, a difference of 0.15%), and Immigrants from Laos (5.5%, a difference of 0.18%).
| Demographics | Rating | Rank | Unemployment Among Women with Children Under 18 years |
| Syrians | 42.8 /100 | #179 | Average 5.5% |
| Immigrants | Southern Europe | 42.7 /100 | #180 | Average 5.5% |
| Immigrants | Hungary | 41.3 /100 | #181 | Average 5.5% |
| Immigrants | Sudan | 40.6 /100 | #182 | Average 5.5% |
| Immigrants | Laos | 38.8 /100 | #183 | Fair 5.5% |
| Immigrants | Cambodia | 38.4 /100 | #184 | Fair 5.5% |
| Immigrants | Zaire | 38.1 /100 | #185 | Fair 5.5% |
| Indonesians | 36.3 /100 | #186 | Fair 5.5% |
| Malaysians | 35.7 /100 | #187 | Fair 5.5% |
| Iraqis | 35.3 /100 | #188 | Fair 5.5% |
| Immigrants | Eritrea | 33.8 /100 | #189 | Fair 5.5% |
| Immigrants | Poland | 31.2 /100 | #190 | Fair 5.5% |
| South American Indians | 30.8 /100 | #191 | Fair 5.5% |
| Immigrants | Spain | 30.7 /100 | #192 | Fair 5.5% |
| Immigrants | Afghanistan | 29.3 /100 | #193 | Fair 5.5% |