French vs Immigrants from Dominican Republic Child Poverty Under the Age of 5
COMPARE
French
Immigrants from Dominican Republic
Child Poverty Under the Age of 5
Child Poverty Under the Age of 5 Comparison
French
Immigrants from Dominican Republic
17.5%
CHILD POVERTY UNDER THE AGE OF 5
33.6/ 100
METRIC RATING
189th/ 347
METRIC RANK
24.1%
CHILD POVERTY UNDER THE AGE OF 5
0.0/ 100
METRIC RATING
328th/ 347
METRIC RANK
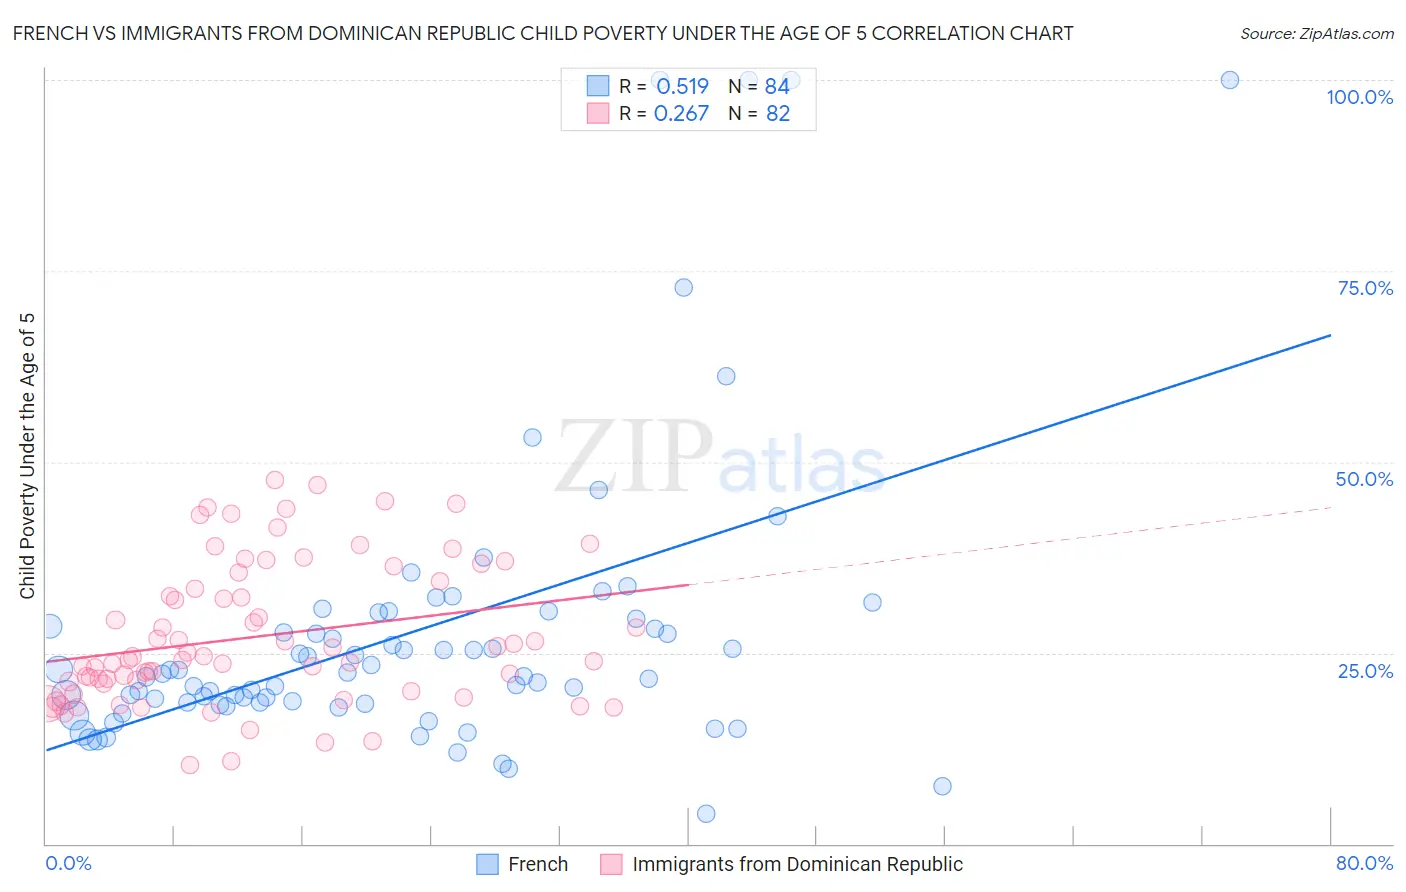
French vs Immigrants from Dominican Republic Child Poverty Under the Age of 5 Correlation Chart
The statistical analysis conducted on geographies consisting of 531,494,079 people shows a substantial positive correlation between the proportion of French and poverty level among children under the age of 5 in the United States with a correlation coefficient (R) of 0.519 and weighted average of 17.5%. Similarly, the statistical analysis conducted on geographies consisting of 266,224,644 people shows a weak positive correlation between the proportion of Immigrants from Dominican Republic and poverty level among children under the age of 5 in the United States with a correlation coefficient (R) of 0.267 and weighted average of 24.1%, a difference of 37.2%.
Child Poverty Under the Age of 5 Correlation Summary
| Measurement | French | Immigrants from Dominican Republic |
| Minimum | 4.0% | 10.3% |
| Maximum | 100.0% | 47.5% |
| Range | 96.0% | 37.2% |
| Mean | 27.5% | 27.1% |
| Median | 22.1% | 24.3% |
| Interquartile 25% (IQ1) | 18.4% | 20.9% |
| Interquartile 75% (IQ3) | 28.9% | 34.4% |
| Interquartile Range (IQR) | 10.5% | 13.5% |
| Standard Deviation (Sample) | 19.4% | 9.2% |
| Standard Deviation (Population) | 19.3% | 9.1% |
Similar Demographics by Child Poverty Under the Age of 5
Demographics Similar to French by Child Poverty Under the Age of 5
In terms of child poverty under the age of 5, the demographic groups most similar to French are Carpatho Rusyn (17.5%, a difference of 0.010%), Kenyan (17.5%, a difference of 0.12%), Immigrants from Bosnia and Herzegovina (17.5%, a difference of 0.16%), Immigrants from Armenia (17.5%, a difference of 0.49%), and Slovak (17.6%, a difference of 0.52%).
| Demographics | Rating | Rank | Child Poverty Under the Age of 5 |
| Arabs | 40.7 /100 | #182 | Average 17.4% |
| Lebanese | 40.3 /100 | #183 | Average 17.4% |
| Immigrants | Costa Rica | 39.0 /100 | #184 | Fair 17.4% |
| Immigrants | Armenia | 38.0 /100 | #185 | Fair 17.5% |
| Immigrants | Bosnia and Herzegovina | 35.0 /100 | #186 | Fair 17.5% |
| Kenyans | 34.7 /100 | #187 | Fair 17.5% |
| Carpatho Rusyns | 33.6 /100 | #188 | Fair 17.5% |
| French | 33.6 /100 | #189 | Fair 17.5% |
| Slovaks | 29.2 /100 | #190 | Fair 17.6% |
| Immigrants | Afghanistan | 27.9 /100 | #191 | Fair 17.7% |
| Immigrants | Uruguay | 27.8 /100 | #192 | Fair 17.7% |
| Immigrants | Uganda | 25.0 /100 | #193 | Fair 17.7% |
| French Canadians | 24.6 /100 | #194 | Fair 17.7% |
| Sierra Leoneans | 24.1 /100 | #195 | Fair 17.7% |
| Immigrants | Portugal | 22.2 /100 | #196 | Fair 17.8% |
Demographics Similar to Immigrants from Dominican Republic by Child Poverty Under the Age of 5
In terms of child poverty under the age of 5, the demographic groups most similar to Immigrants from Dominican Republic are Dominican (24.0%, a difference of 0.090%), Cajun (24.1%, a difference of 0.23%), Central American Indian (23.9%, a difference of 0.55%), Creek (24.2%, a difference of 0.67%), and Immigrants from Congo (23.9%, a difference of 0.73%).
| Demographics | Rating | Rank | Child Poverty Under the Age of 5 |
| Immigrants | Honduras | 0.0 /100 | #321 | Tragic 23.5% |
| Ute | 0.0 /100 | #322 | Tragic 23.5% |
| Pueblo | 0.0 /100 | #323 | Tragic 23.7% |
| Paiute | 0.0 /100 | #324 | Tragic 23.8% |
| Immigrants | Congo | 0.0 /100 | #325 | Tragic 23.9% |
| Central American Indians | 0.0 /100 | #326 | Tragic 23.9% |
| Dominicans | 0.0 /100 | #327 | Tragic 24.0% |
| Immigrants | Dominican Republic | 0.0 /100 | #328 | Tragic 24.1% |
| Cajuns | 0.0 /100 | #329 | Tragic 24.1% |
| Creek | 0.0 /100 | #330 | Tragic 24.2% |
| Kiowa | 0.0 /100 | #331 | Tragic 24.5% |
| Apache | 0.0 /100 | #332 | Tragic 25.0% |
| Natives/Alaskans | 0.0 /100 | #333 | Tragic 25.6% |
| Blacks/African Americans | 0.0 /100 | #334 | Tragic 25.7% |
| Colville | 0.0 /100 | #335 | Tragic 25.7% |