White/Caucasian vs Pima Child Poverty Under the Age of 5
COMPARE
White/Caucasian
Pima
Child Poverty Under the Age of 5
Child Poverty Under the Age of 5 Comparison
Whites/Caucasians
Pima
18.1%
CHILD POVERTY UNDER THE AGE OF 5
12.6/ 100
METRIC RATING
206th/ 347
METRIC RANK
27.4%
CHILD POVERTY UNDER THE AGE OF 5
0.0/ 100
METRIC RATING
337th/ 347
METRIC RANK
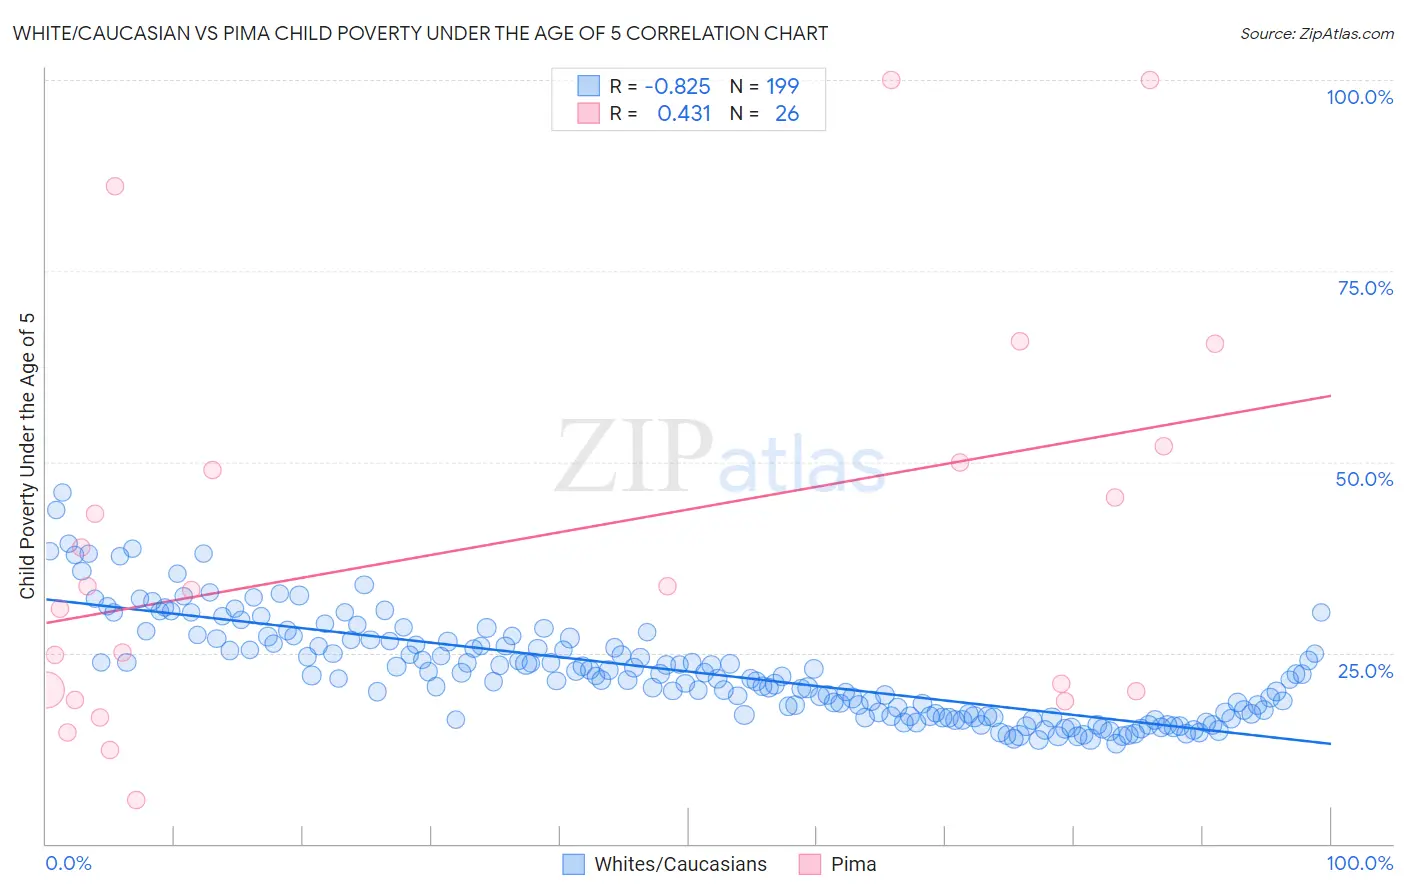
White/Caucasian vs Pima Child Poverty Under the Age of 5 Correlation Chart
The statistical analysis conducted on geographies consisting of 539,824,929 people shows a very strong negative correlation between the proportion of Whites/Caucasians and poverty level among children under the age of 5 in the United States with a correlation coefficient (R) of -0.825 and weighted average of 18.1%. Similarly, the statistical analysis conducted on geographies consisting of 61,270,853 people shows a moderate positive correlation between the proportion of Pima and poverty level among children under the age of 5 in the United States with a correlation coefficient (R) of 0.431 and weighted average of 27.4%, a difference of 51.6%.
Child Poverty Under the Age of 5 Correlation Summary
| Measurement | White/Caucasian | Pima |
| Minimum | 13.1% | 5.8% |
| Maximum | 46.1% | 100.0% |
| Range | 32.9% | 94.2% |
| Mean | 22.6% | 39.4% |
| Median | 21.9% | 33.4% |
| Interquartile 25% (IQ1) | 16.7% | 20.0% |
| Interquartile 75% (IQ3) | 26.5% | 50.0% |
| Interquartile Range (IQR) | 9.8% | 30.0% |
| Standard Deviation (Sample) | 6.6% | 26.0% |
| Standard Deviation (Population) | 6.6% | 25.5% |
Similar Demographics by Child Poverty Under the Age of 5
Demographics Similar to Whites/Caucasians by Child Poverty Under the Age of 5
In terms of child poverty under the age of 5, the demographic groups most similar to Whites/Caucasians are Spaniard (18.1%, a difference of 0.060%), Immigrants from Eastern Africa (18.1%, a difference of 0.19%), Immigrants from Cambodia (18.1%, a difference of 0.25%), Japanese (18.1%, a difference of 0.27%), and Ugandan (18.0%, a difference of 0.29%).
| Demographics | Rating | Rank | Child Poverty Under the Age of 5 |
| Hungarians | 18.3 /100 | #199 | Poor 17.9% |
| Iraqis | 14.0 /100 | #200 | Poor 18.0% |
| Ugandans | 13.9 /100 | #201 | Poor 18.0% |
| Japanese | 13.8 /100 | #202 | Poor 18.1% |
| Immigrants | Cambodia | 13.7 /100 | #203 | Poor 18.1% |
| Immigrants | Eastern Africa | 13.4 /100 | #204 | Poor 18.1% |
| Spaniards | 12.8 /100 | #205 | Poor 18.1% |
| Whites/Caucasians | 12.6 /100 | #206 | Poor 18.1% |
| Immigrants | Immigrants | 9.9 /100 | #207 | Tragic 18.2% |
| Scotch-Irish | 9.8 /100 | #208 | Tragic 18.2% |
| Spanish | 9.8 /100 | #209 | Tragic 18.2% |
| Panamanians | 9.7 /100 | #210 | Tragic 18.2% |
| Moroccans | 9.4 /100 | #211 | Tragic 18.2% |
| Nepalese | 8.7 /100 | #212 | Tragic 18.3% |
| Immigrants | Thailand | 8.6 /100 | #213 | Tragic 18.3% |
Demographics Similar to Pima by Child Poverty Under the Age of 5
In terms of child poverty under the age of 5, the demographic groups most similar to Pima are Hopi (27.7%, a difference of 1.0%), Yup'ik (27.7%, a difference of 1.1%), Sioux (26.9%, a difference of 1.9%), Cheyenne (28.3%, a difference of 3.3%), and Colville (25.7%, a difference of 6.8%).
| Demographics | Rating | Rank | Child Poverty Under the Age of 5 |
| Creek | 0.0 /100 | #330 | Tragic 24.2% |
| Kiowa | 0.0 /100 | #331 | Tragic 24.5% |
| Apache | 0.0 /100 | #332 | Tragic 25.0% |
| Natives/Alaskans | 0.0 /100 | #333 | Tragic 25.6% |
| Blacks/African Americans | 0.0 /100 | #334 | Tragic 25.7% |
| Colville | 0.0 /100 | #335 | Tragic 25.7% |
| Sioux | 0.0 /100 | #336 | Tragic 26.9% |
| Pima | 0.0 /100 | #337 | Tragic 27.4% |
| Hopi | 0.0 /100 | #338 | Tragic 27.7% |
| Yup'ik | 0.0 /100 | #339 | Tragic 27.7% |
| Cheyenne | 0.0 /100 | #340 | Tragic 28.3% |
| Immigrants | Yemen | 0.0 /100 | #341 | Tragic 29.3% |
| Tohono O'odham | 0.0 /100 | #342 | Tragic 29.5% |
| Yuman | 0.0 /100 | #343 | Tragic 29.5% |
| Crow | 0.0 /100 | #344 | Tragic 31.0% |