Vietnamese vs Israeli Family Poverty
COMPARE
Vietnamese
Israeli
Family Poverty
Family Poverty Comparison
Vietnamese
Israelis
11.5%
FAMILY POVERTY
0.0/ 100
METRIC RATING
287th/ 347
METRIC RANK
8.9%
FAMILY POVERTY
62.1/ 100
METRIC RATING
168th/ 347
METRIC RANK
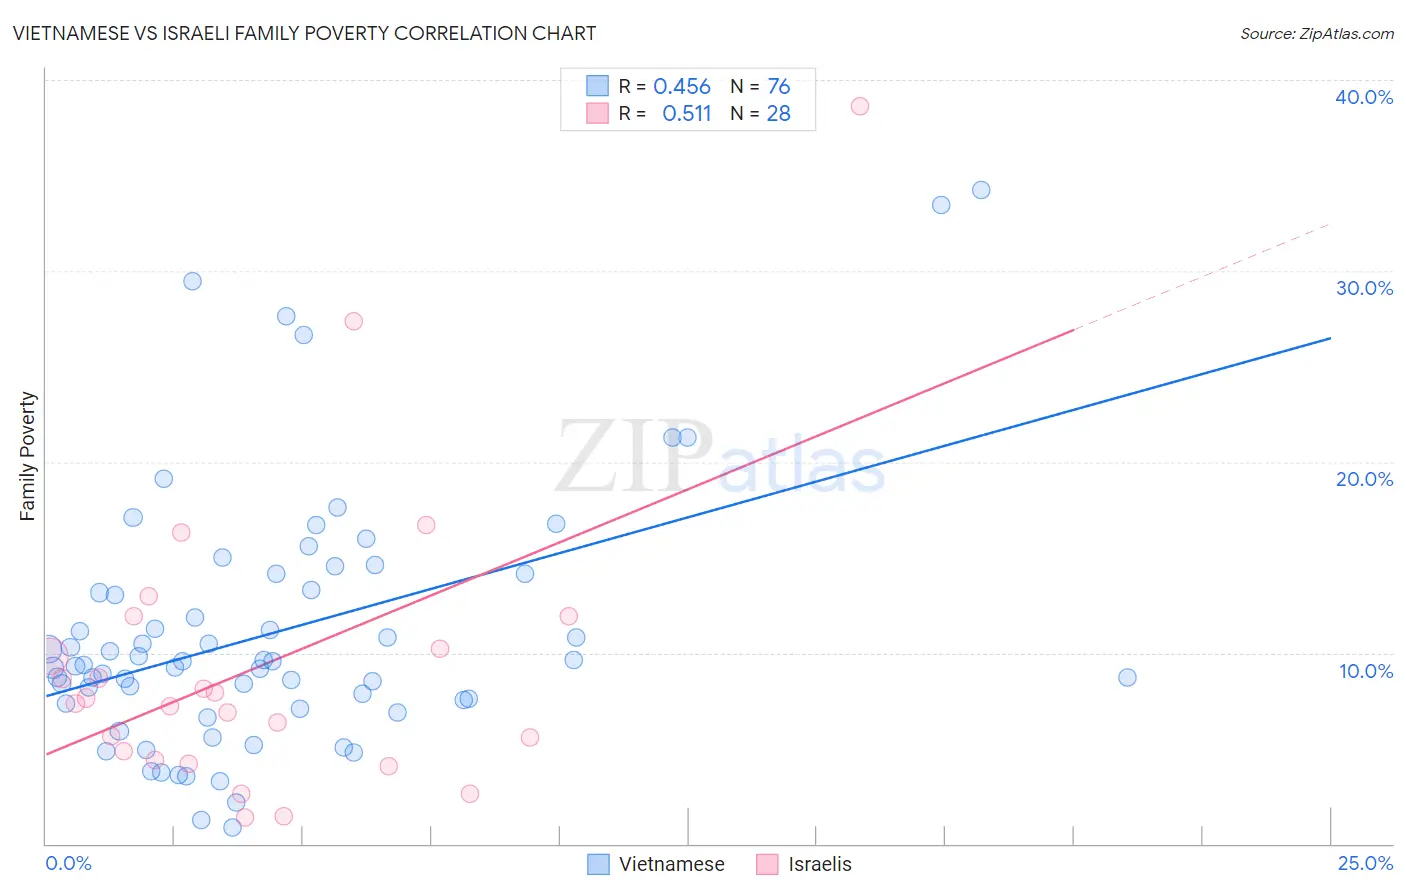
Vietnamese vs Israeli Family Poverty Correlation Chart
The statistical analysis conducted on geographies consisting of 170,550,296 people shows a moderate positive correlation between the proportion of Vietnamese and poverty level among families in the United States with a correlation coefficient (R) of 0.456 and weighted average of 11.5%. Similarly, the statistical analysis conducted on geographies consisting of 210,674,574 people shows a substantial positive correlation between the proportion of Israelis and poverty level among families in the United States with a correlation coefficient (R) of 0.511 and weighted average of 8.9%, a difference of 29.7%.
Family Poverty Correlation Summary
| Measurement | Vietnamese | Israeli |
| Minimum | 0.88% | 1.4% |
| Maximum | 34.2% | 38.6% |
| Range | 33.4% | 37.2% |
| Mean | 11.1% | 9.3% |
| Median | 9.4% | 7.5% |
| Interquartile 25% (IQ1) | 7.4% | 4.6% |
| Interquartile 75% (IQ3) | 13.7% | 11.0% |
| Interquartile Range (IQR) | 6.3% | 6.4% |
| Standard Deviation (Sample) | 6.8% | 7.9% |
| Standard Deviation (Population) | 6.7% | 7.8% |
Similar Demographics by Family Poverty
Demographics Similar to Vietnamese by Family Poverty
In terms of family poverty, the demographic groups most similar to Vietnamese are Immigrants from Belize (11.5%, a difference of 0.19%), Immigrants from Barbados (11.5%, a difference of 0.24%), West Indian (11.5%, a difference of 0.25%), Senegalese (11.5%, a difference of 0.27%), and Haitian (11.5%, a difference of 0.31%).
| Demographics | Rating | Rank | Family Poverty |
| Belizeans | 0.0 /100 | #280 | Tragic 11.3% |
| Immigrants | West Indies | 0.0 /100 | #281 | Tragic 11.3% |
| Immigrants | Cuba | 0.0 /100 | #282 | Tragic 11.3% |
| Indonesians | 0.0 /100 | #283 | Tragic 11.3% |
| Yaqui | 0.0 /100 | #284 | Tragic 11.3% |
| Barbadians | 0.0 /100 | #285 | Tragic 11.3% |
| Senegalese | 0.0 /100 | #286 | Tragic 11.5% |
| Vietnamese | 0.0 /100 | #287 | Tragic 11.5% |
| Immigrants | Belize | 0.0 /100 | #288 | Tragic 11.5% |
| Immigrants | Barbados | 0.0 /100 | #289 | Tragic 11.5% |
| West Indians | 0.0 /100 | #290 | Tragic 11.5% |
| Haitians | 0.0 /100 | #291 | Tragic 11.5% |
| Immigrants | Somalia | 0.0 /100 | #292 | Tragic 11.5% |
| Immigrants | Cabo Verde | 0.0 /100 | #293 | Tragic 11.6% |
| Immigrants | St. Vincent and the Grenadines | 0.0 /100 | #294 | Tragic 11.6% |
Demographics Similar to Israelis by Family Poverty
In terms of family poverty, the demographic groups most similar to Israelis are Immigrants from Ethiopia (8.9%, a difference of 0.060%), Afghan (8.8%, a difference of 0.20%), Immigrants from Chile (8.9%, a difference of 0.35%), Guamanian/Chamorro (8.8%, a difference of 0.38%), and Celtic (8.8%, a difference of 0.41%).
| Demographics | Rating | Rank | Family Poverty |
| Immigrants | Northern Africa | 66.9 /100 | #161 | Good 8.8% |
| Ethiopians | 66.3 /100 | #162 | Good 8.8% |
| Pennsylvania Germans | 66.0 /100 | #163 | Good 8.8% |
| Celtics | 64.9 /100 | #164 | Good 8.8% |
| Guamanians/Chamorros | 64.7 /100 | #165 | Good 8.8% |
| Afghans | 63.5 /100 | #166 | Good 8.8% |
| Immigrants | Ethiopia | 62.5 /100 | #167 | Good 8.9% |
| Israelis | 62.1 /100 | #168 | Good 8.9% |
| Immigrants | Chile | 59.6 /100 | #169 | Average 8.9% |
| Kenyans | 58.2 /100 | #170 | Average 8.9% |
| Lebanese | 57.6 /100 | #171 | Average 8.9% |
| Immigrants | Peru | 57.5 /100 | #172 | Average 8.9% |
| Immigrants | Fiji | 56.4 /100 | #173 | Average 8.9% |
| Immigrants | Albania | 50.0 /100 | #174 | Average 9.0% |
| Costa Ricans | 49.3 /100 | #175 | Average 9.0% |