Immigrants from Japan vs Israeli Family Poverty
COMPARE
Immigrants from Japan
Israeli
Family Poverty
Family Poverty Comparison
Immigrants from Japan
Israelis
7.4%
FAMILY POVERTY
99.5/ 100
METRIC RATING
33rd/ 347
METRIC RANK
8.9%
FAMILY POVERTY
62.1/ 100
METRIC RATING
168th/ 347
METRIC RANK
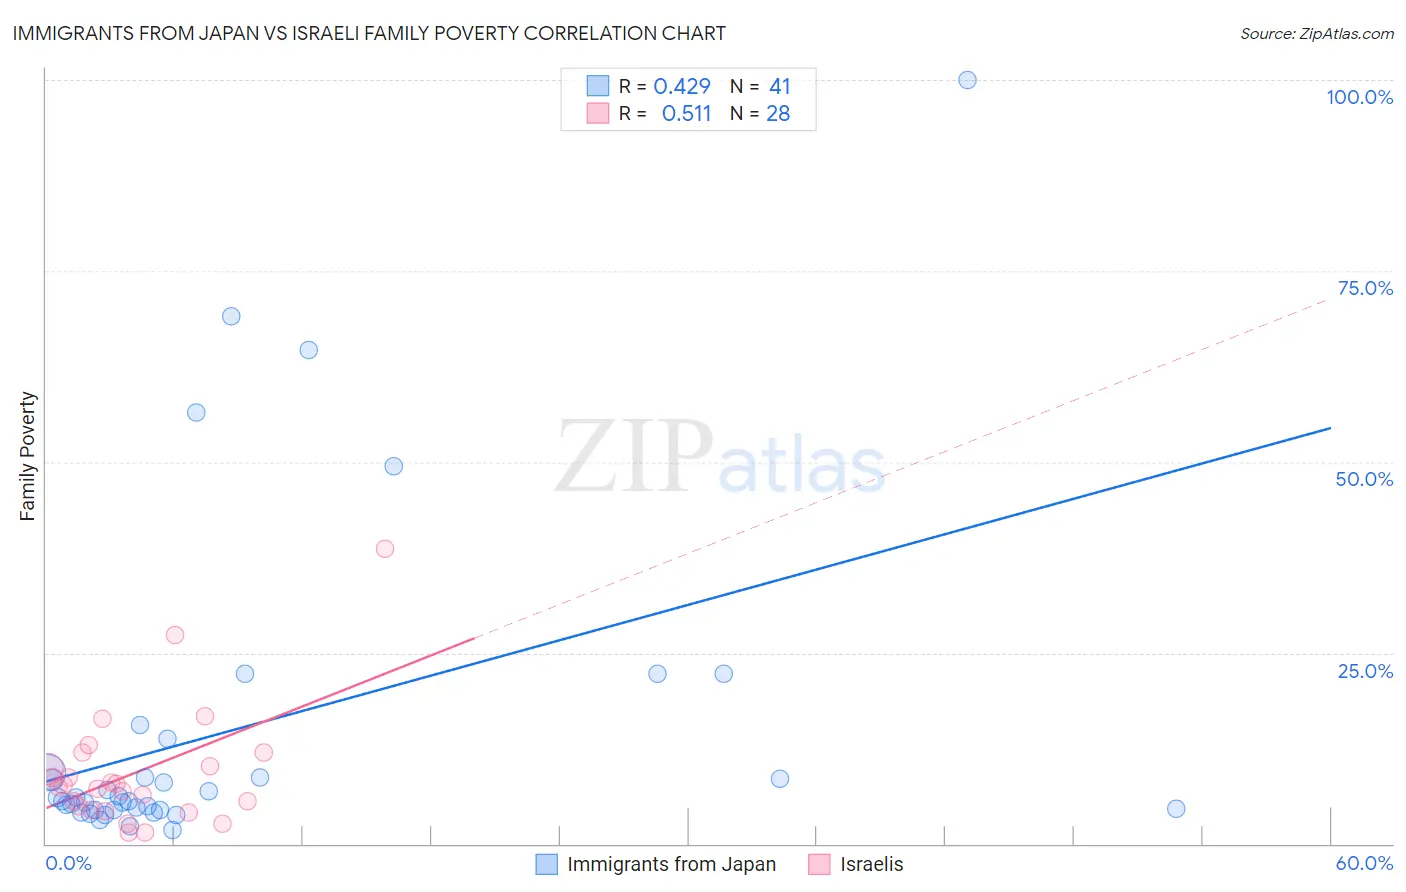
Immigrants from Japan vs Israeli Family Poverty Correlation Chart
The statistical analysis conducted on geographies consisting of 339,424,982 people shows a moderate positive correlation between the proportion of Immigrants from Japan and poverty level among families in the United States with a correlation coefficient (R) of 0.429 and weighted average of 7.4%. Similarly, the statistical analysis conducted on geographies consisting of 210,674,574 people shows a substantial positive correlation between the proportion of Israelis and poverty level among families in the United States with a correlation coefficient (R) of 0.511 and weighted average of 8.9%, a difference of 19.2%.
Family Poverty Correlation Summary
| Measurement | Immigrants from Japan | Israeli |
| Minimum | 1.7% | 1.4% |
| Maximum | 100.0% | 38.6% |
| Range | 98.3% | 37.2% |
| Mean | 14.8% | 9.3% |
| Median | 6.1% | 7.5% |
| Interquartile 25% (IQ1) | 4.4% | 4.6% |
| Interquartile 75% (IQ3) | 11.6% | 11.0% |
| Interquartile Range (IQR) | 7.1% | 6.4% |
| Standard Deviation (Sample) | 21.6% | 7.9% |
| Standard Deviation (Population) | 21.3% | 7.8% |
Similar Demographics by Family Poverty
Demographics Similar to Immigrants from Japan by Family Poverty
In terms of family poverty, the demographic groups most similar to Immigrants from Japan are Polish (7.4%, a difference of 0.0%), Russian (7.5%, a difference of 0.23%), Czech (7.4%, a difference of 0.30%), Italian (7.4%, a difference of 0.42%), and Immigrants from Northern Europe (7.4%, a difference of 0.71%).
| Demographics | Rating | Rank | Family Poverty |
| Cypriots | 99.6 /100 | #26 | Exceptional 7.3% |
| Immigrants | Scotland | 99.6 /100 | #27 | Exceptional 7.3% |
| Immigrants | Korea | 99.6 /100 | #28 | Exceptional 7.4% |
| Immigrants | Northern Europe | 99.6 /100 | #29 | Exceptional 7.4% |
| Italians | 99.6 /100 | #30 | Exceptional 7.4% |
| Czechs | 99.6 /100 | #31 | Exceptional 7.4% |
| Poles | 99.5 /100 | #32 | Exceptional 7.4% |
| Immigrants | Japan | 99.5 /100 | #33 | Exceptional 7.4% |
| Russians | 99.5 /100 | #34 | Exceptional 7.5% |
| Greeks | 99.4 /100 | #35 | Exceptional 7.5% |
| Turks | 99.4 /100 | #36 | Exceptional 7.5% |
| Estonians | 99.4 /100 | #37 | Exceptional 7.5% |
| Bolivians | 99.3 /100 | #38 | Exceptional 7.5% |
| Carpatho Rusyns | 99.3 /100 | #39 | Exceptional 7.5% |
| Slovenes | 99.3 /100 | #40 | Exceptional 7.5% |
Demographics Similar to Israelis by Family Poverty
In terms of family poverty, the demographic groups most similar to Israelis are Immigrants from Ethiopia (8.9%, a difference of 0.060%), Afghan (8.8%, a difference of 0.20%), Immigrants from Chile (8.9%, a difference of 0.35%), Guamanian/Chamorro (8.8%, a difference of 0.38%), and Celtic (8.8%, a difference of 0.41%).
| Demographics | Rating | Rank | Family Poverty |
| Immigrants | Northern Africa | 66.9 /100 | #161 | Good 8.8% |
| Ethiopians | 66.3 /100 | #162 | Good 8.8% |
| Pennsylvania Germans | 66.0 /100 | #163 | Good 8.8% |
| Celtics | 64.9 /100 | #164 | Good 8.8% |
| Guamanians/Chamorros | 64.7 /100 | #165 | Good 8.8% |
| Afghans | 63.5 /100 | #166 | Good 8.8% |
| Immigrants | Ethiopia | 62.5 /100 | #167 | Good 8.9% |
| Israelis | 62.1 /100 | #168 | Good 8.9% |
| Immigrants | Chile | 59.6 /100 | #169 | Average 8.9% |
| Kenyans | 58.2 /100 | #170 | Average 8.9% |
| Lebanese | 57.6 /100 | #171 | Average 8.9% |
| Immigrants | Peru | 57.5 /100 | #172 | Average 8.9% |
| Immigrants | Fiji | 56.4 /100 | #173 | Average 8.9% |
| Immigrants | Albania | 50.0 /100 | #174 | Average 9.0% |
| Costa Ricans | 49.3 /100 | #175 | Average 9.0% |