Immigrants from Senegal vs Immigrants from South Eastern Asia Female Poverty
COMPARE
Immigrants from Senegal
Immigrants from South Eastern Asia
Female Poverty
Female Poverty Comparison
Immigrants from Senegal
Immigrants from South Eastern Asia
16.5%
FEMALE POVERTY
0.0/ 100
METRIC RATING
296th/ 347
METRIC RANK
12.7%
FEMALE POVERTY
89.9/ 100
METRIC RATING
123rd/ 347
METRIC RANK
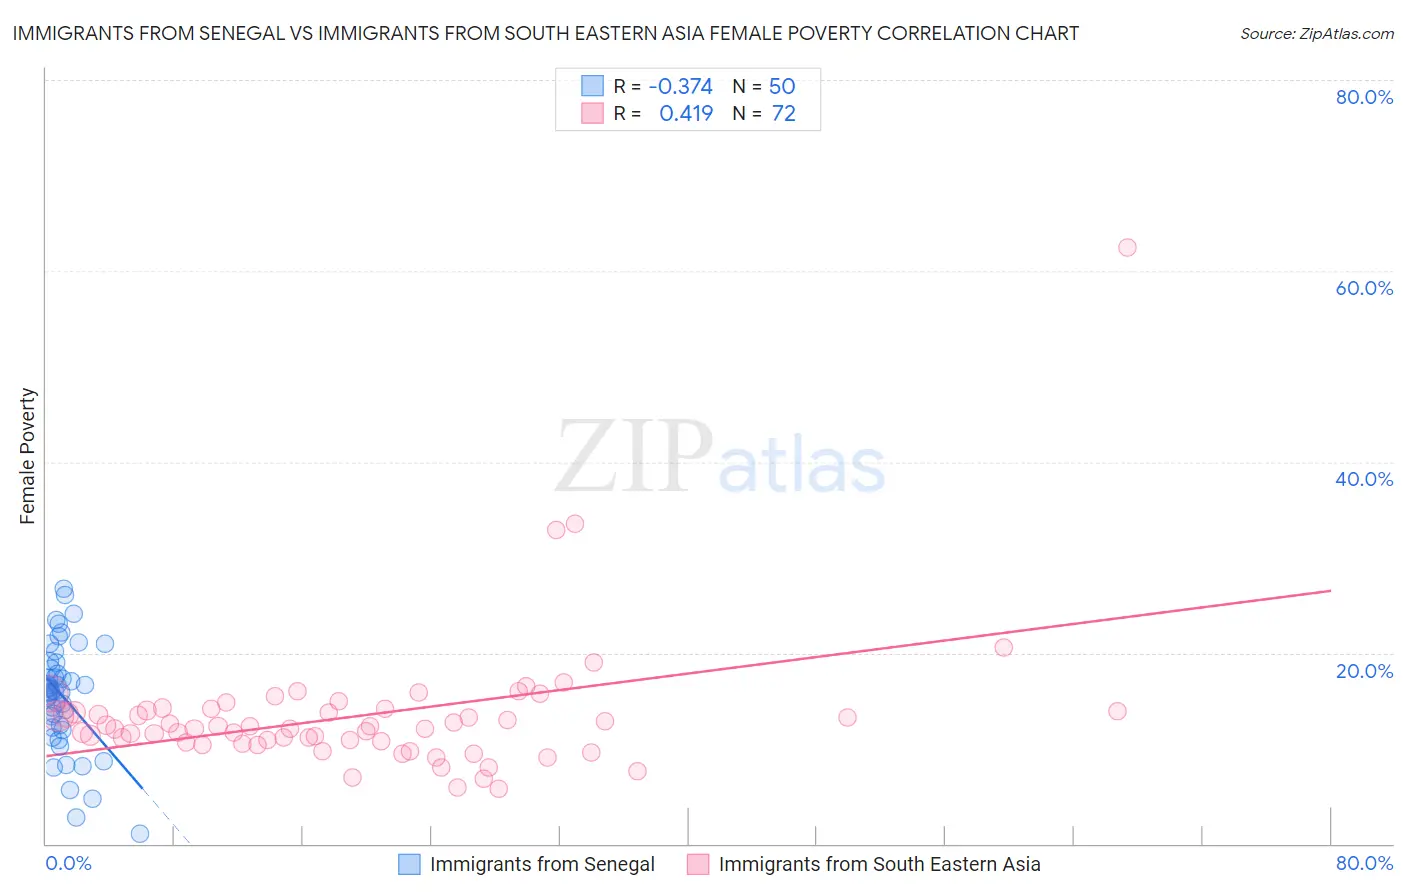
Immigrants from Senegal vs Immigrants from South Eastern Asia Female Poverty Correlation Chart
The statistical analysis conducted on geographies consisting of 90,102,855 people shows a mild negative correlation between the proportion of Immigrants from Senegal and poverty level among females in the United States with a correlation coefficient (R) of -0.374 and weighted average of 16.5%. Similarly, the statistical analysis conducted on geographies consisting of 512,071,275 people shows a moderate positive correlation between the proportion of Immigrants from South Eastern Asia and poverty level among females in the United States with a correlation coefficient (R) of 0.419 and weighted average of 12.7%, a difference of 29.2%.
Female Poverty Correlation Summary
| Measurement | Immigrants from Senegal | Immigrants from South Eastern Asia |
| Minimum | 1.1% | 5.8% |
| Maximum | 26.7% | 62.5% |
| Range | 25.6% | 56.7% |
| Mean | 15.4% | 13.4% |
| Median | 16.0% | 12.2% |
| Interquartile 25% (IQ1) | 12.2% | 10.6% |
| Interquartile 75% (IQ3) | 19.0% | 14.0% |
| Interquartile Range (IQR) | 6.8% | 3.4% |
| Standard Deviation (Sample) | 5.7% | 7.4% |
| Standard Deviation (Population) | 5.6% | 7.3% |
Similar Demographics by Female Poverty
Demographics Similar to Immigrants from Senegal by Female Poverty
In terms of female poverty, the demographic groups most similar to Immigrants from Senegal are Senegalese (16.5%, a difference of 0.020%), Immigrants from Cabo Verde (16.4%, a difference of 0.10%), Immigrants from Latin America (16.4%, a difference of 0.13%), Immigrants from Zaire (16.4%, a difference of 0.19%), and Yaqui (16.4%, a difference of 0.20%).
| Demographics | Rating | Rank | Female Poverty |
| Blackfeet | 0.0 /100 | #289 | Tragic 16.4% |
| Immigrants | Bangladesh | 0.0 /100 | #290 | Tragic 16.4% |
| Yaqui | 0.0 /100 | #291 | Tragic 16.4% |
| Immigrants | Zaire | 0.0 /100 | #292 | Tragic 16.4% |
| Immigrants | Latin America | 0.0 /100 | #293 | Tragic 16.4% |
| Immigrants | Cabo Verde | 0.0 /100 | #294 | Tragic 16.4% |
| Senegalese | 0.0 /100 | #295 | Tragic 16.5% |
| Immigrants | Senegal | 0.0 /100 | #296 | Tragic 16.5% |
| Mexicans | 0.0 /100 | #297 | Tragic 16.5% |
| Somalis | 0.0 /100 | #298 | Tragic 16.6% |
| Hispanics or Latinos | 0.0 /100 | #299 | Tragic 16.6% |
| Bahamians | 0.0 /100 | #300 | Tragic 16.6% |
| Guatemalans | 0.0 /100 | #301 | Tragic 16.7% |
| Chippewa | 0.0 /100 | #302 | Tragic 16.7% |
| Choctaw | 0.0 /100 | #303 | Tragic 16.8% |
Demographics Similar to Immigrants from South Eastern Asia by Female Poverty
In terms of female poverty, the demographic groups most similar to Immigrants from South Eastern Asia are French Canadian (12.7%, a difference of 0.070%), Immigrants from Hungary (12.7%, a difference of 0.10%), Immigrants from Norway (12.8%, a difference of 0.18%), New Zealander (12.7%, a difference of 0.21%), and Argentinean (12.8%, a difference of 0.23%).
| Demographics | Rating | Rank | Female Poverty |
| Immigrants | Russia | 91.2 /100 | #116 | Exceptional 12.7% |
| Immigrants | Southern Europe | 90.9 /100 | #117 | Exceptional 12.7% |
| Sri Lankans | 90.9 /100 | #118 | Exceptional 12.7% |
| Albanians | 90.8 /100 | #119 | Exceptional 12.7% |
| New Zealanders | 90.6 /100 | #120 | Exceptional 12.7% |
| Immigrants | Hungary | 90.3 /100 | #121 | Exceptional 12.7% |
| French Canadians | 90.2 /100 | #122 | Exceptional 12.7% |
| Immigrants | South Eastern Asia | 89.9 /100 | #123 | Excellent 12.7% |
| Immigrants | Norway | 89.3 /100 | #124 | Excellent 12.8% |
| Argentineans | 89.1 /100 | #125 | Excellent 12.8% |
| Immigrants | Ukraine | 88.8 /100 | #126 | Excellent 12.8% |
| South Africans | 88.4 /100 | #127 | Excellent 12.8% |
| Immigrants | Belarus | 88.2 /100 | #128 | Excellent 12.8% |
| Immigrants | Brazil | 87.9 /100 | #129 | Excellent 12.8% |
| Immigrants | Vietnam | 87.1 /100 | #130 | Excellent 12.8% |