French American Indian vs Argentinean Single Male Poverty
COMPARE
French American Indian
Argentinean
Single Male Poverty
Single Male Poverty Comparison
French American Indians
Argentineans
15.0%
SINGLE MALE POVERTY
0.0/ 100
METRIC RATING
298th/ 347
METRIC RANK
11.9%
SINGLE MALE POVERTY
99.5/ 100
METRIC RATING
73rd/ 347
METRIC RANK
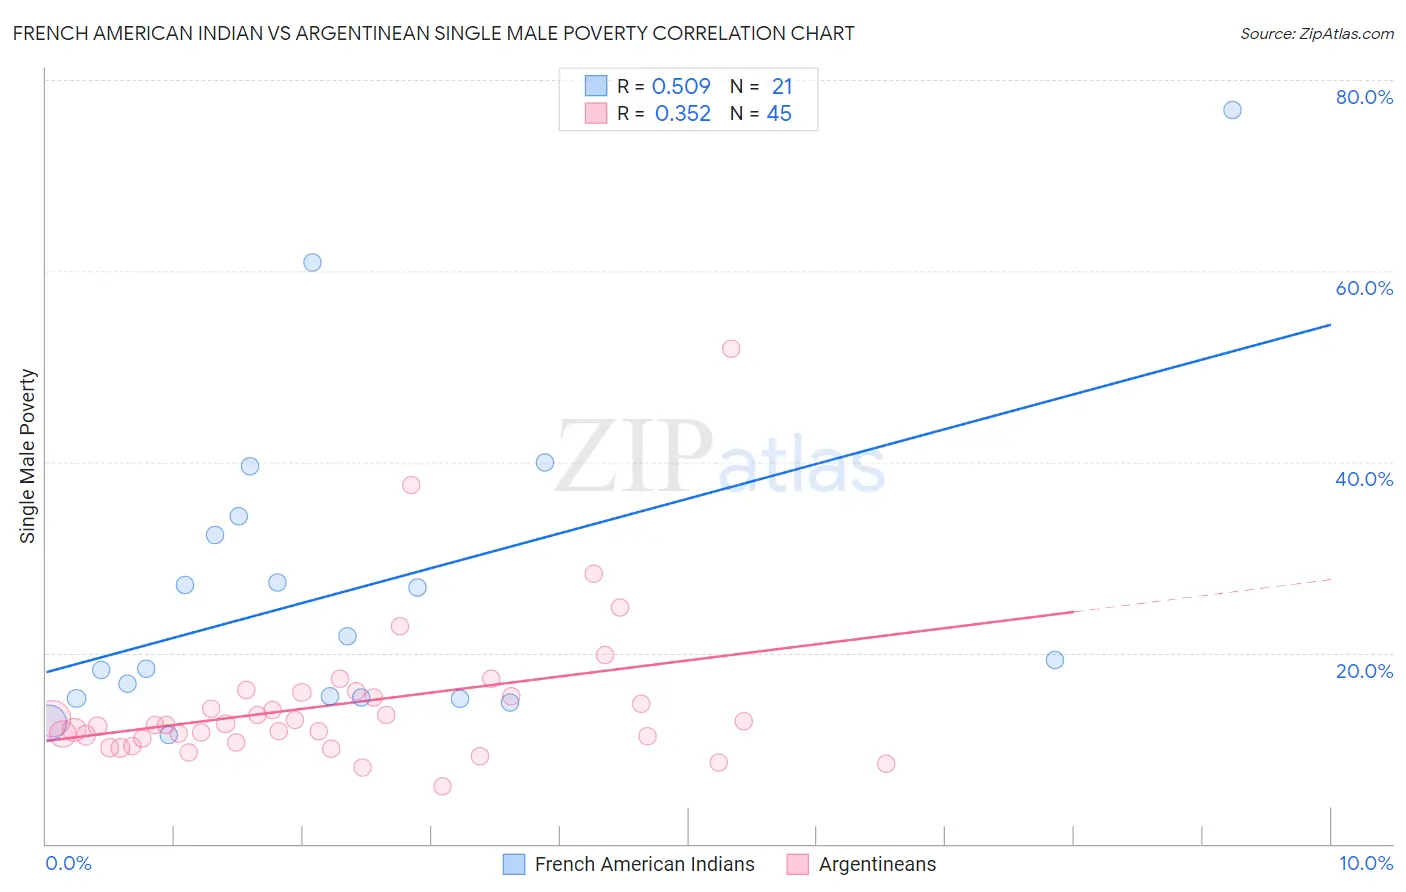
French American Indian vs Argentinean Single Male Poverty Correlation Chart
The statistical analysis conducted on geographies consisting of 125,004,458 people shows a substantial positive correlation between the proportion of French American Indians and poverty level among single males in the United States with a correlation coefficient (R) of 0.509 and weighted average of 15.0%. Similarly, the statistical analysis conducted on geographies consisting of 268,813,546 people shows a mild positive correlation between the proportion of Argentineans and poverty level among single males in the United States with a correlation coefficient (R) of 0.352 and weighted average of 11.9%, a difference of 25.7%.
Single Male Poverty Correlation Summary
| Measurement | French American Indian | Argentinean |
| Minimum | 11.4% | 6.0% |
| Maximum | 76.9% | 51.8% |
| Range | 65.5% | 45.8% |
| Mean | 26.7% | 14.7% |
| Median | 19.2% | 12.4% |
| Interquartile 25% (IQ1) | 15.3% | 10.8% |
| Interquartile 75% (IQ3) | 33.3% | 15.6% |
| Interquartile Range (IQR) | 18.0% | 4.8% |
| Standard Deviation (Sample) | 16.6% | 7.9% |
| Standard Deviation (Population) | 16.2% | 7.9% |
Similar Demographics by Single Male Poverty
Demographics Similar to French American Indians by Single Male Poverty
In terms of single male poverty, the demographic groups most similar to French American Indians are Delaware (15.0%, a difference of 0.39%), Cree (15.1%, a difference of 0.84%), Immigrants from Dominican Republic (14.8%, a difference of 1.3%), African (14.7%, a difference of 1.6%), and Dominican (15.2%, a difference of 1.7%).
| Demographics | Rating | Rank | Single Male Poverty |
| Bahamians | 0.0 /100 | #291 | Tragic 14.6% |
| Immigrants | Nonimmigrants | 0.0 /100 | #292 | Tragic 14.6% |
| French Canadians | 0.0 /100 | #293 | Tragic 14.6% |
| Ottawa | 0.0 /100 | #294 | Tragic 14.6% |
| Scotch-Irish | 0.0 /100 | #295 | Tragic 14.7% |
| Africans | 0.0 /100 | #296 | Tragic 14.7% |
| Immigrants | Dominican Republic | 0.0 /100 | #297 | Tragic 14.8% |
| French American Indians | 0.0 /100 | #298 | Tragic 15.0% |
| Delaware | 0.0 /100 | #299 | Tragic 15.0% |
| Cree | 0.0 /100 | #300 | Tragic 15.1% |
| Dominicans | 0.0 /100 | #301 | Tragic 15.2% |
| Alsatians | 0.0 /100 | #302 | Tragic 15.2% |
| Aleuts | 0.0 /100 | #303 | Tragic 15.4% |
| Alaska Natives | 0.0 /100 | #304 | Tragic 15.4% |
| Blackfeet | 0.0 /100 | #305 | Tragic 15.5% |
Demographics Similar to Argentineans by Single Male Poverty
In terms of single male poverty, the demographic groups most similar to Argentineans are Chilean (11.9%, a difference of 0.060%), Immigrants from Argentina (11.9%, a difference of 0.13%), Uruguayan (11.9%, a difference of 0.25%), Immigrants from Northern Africa (11.9%, a difference of 0.27%), and Immigrants from Greece (11.9%, a difference of 0.31%).
| Demographics | Rating | Rank | Single Male Poverty |
| Immigrants | Uruguay | 99.6 /100 | #66 | Exceptional 11.9% |
| Immigrants | Ukraine | 99.6 /100 | #67 | Exceptional 11.9% |
| Immigrants | Croatia | 99.6 /100 | #68 | Exceptional 11.9% |
| Immigrants | Russia | 99.6 /100 | #69 | Exceptional 11.9% |
| Immigrants | Nepal | 99.6 /100 | #70 | Exceptional 11.9% |
| Immigrants | Greece | 99.6 /100 | #71 | Exceptional 11.9% |
| Immigrants | Argentina | 99.5 /100 | #72 | Exceptional 11.9% |
| Argentineans | 99.5 /100 | #73 | Exceptional 11.9% |
| Chileans | 99.5 /100 | #74 | Exceptional 11.9% |
| Uruguayans | 99.4 /100 | #75 | Exceptional 11.9% |
| Immigrants | Northern Africa | 99.4 /100 | #76 | Exceptional 11.9% |
| Immigrants | Malaysia | 99.2 /100 | #77 | Exceptional 12.0% |
| Immigrants | Venezuela | 99.1 /100 | #78 | Exceptional 12.0% |
| Immigrants | Belgium | 99.0 /100 | #79 | Exceptional 12.0% |
| Armenians | 98.7 /100 | #80 | Exceptional 12.1% |