French American Indian vs Sierra Leonean Single Male Poverty
COMPARE
French American Indian
Sierra Leonean
Single Male Poverty
Single Male Poverty Comparison
French American Indians
Sierra Leoneans
15.0%
SINGLE MALE POVERTY
0.0/ 100
METRIC RATING
298th/ 347
METRIC RANK
12.6%
SINGLE MALE POVERTY
73.0/ 100
METRIC RATING
149th/ 347
METRIC RANK
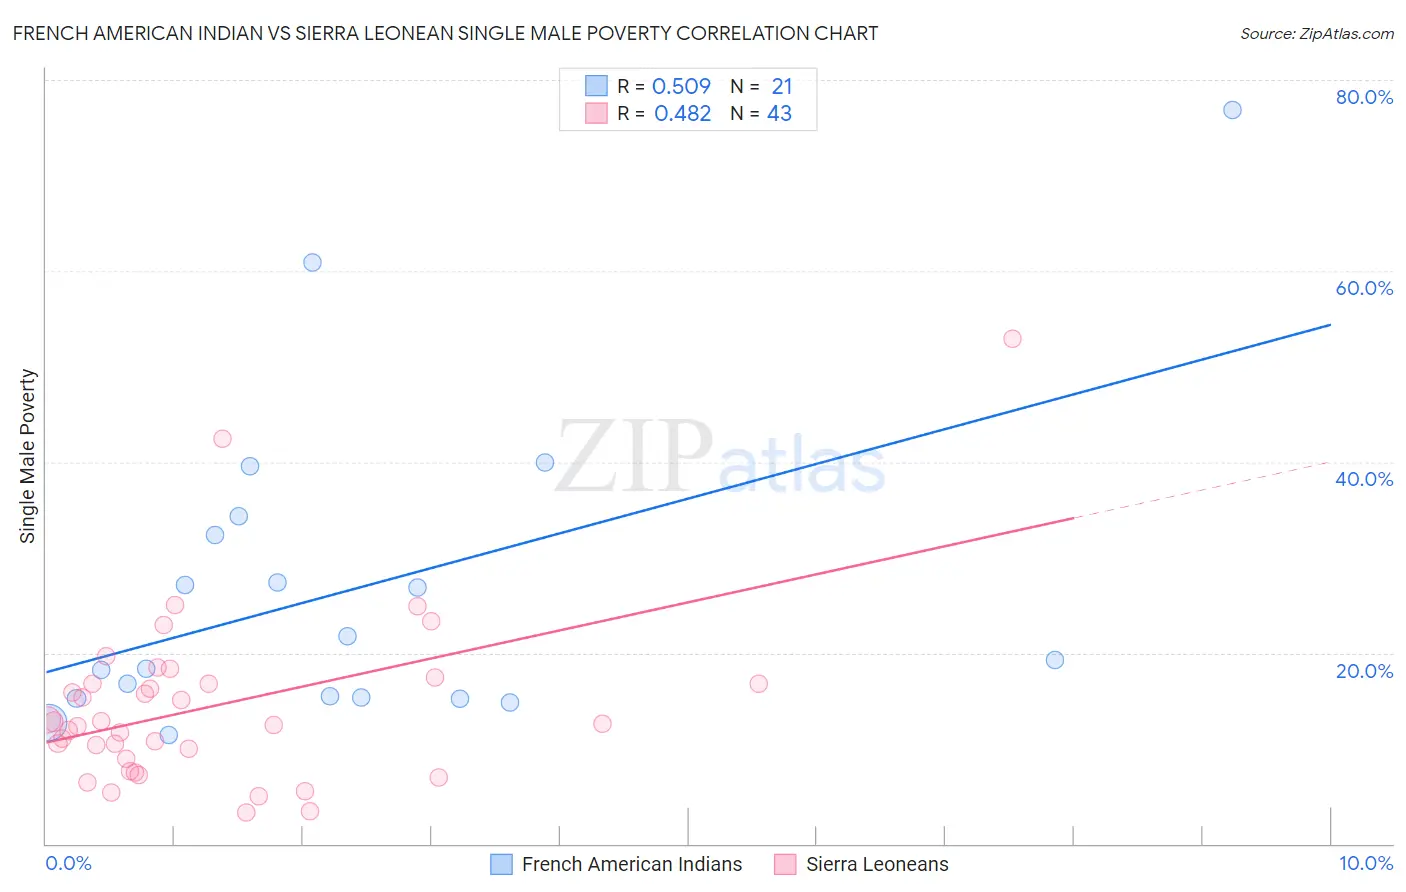
French American Indian vs Sierra Leonean Single Male Poverty Correlation Chart
The statistical analysis conducted on geographies consisting of 125,004,458 people shows a substantial positive correlation between the proportion of French American Indians and poverty level among single males in the United States with a correlation coefficient (R) of 0.509 and weighted average of 15.0%. Similarly, the statistical analysis conducted on geographies consisting of 80,419,123 people shows a moderate positive correlation between the proportion of Sierra Leoneans and poverty level among single males in the United States with a correlation coefficient (R) of 0.482 and weighted average of 12.6%, a difference of 18.5%.
Single Male Poverty Correlation Summary
| Measurement | French American Indian | Sierra Leonean |
| Minimum | 11.4% | 3.2% |
| Maximum | 76.9% | 52.9% |
| Range | 65.5% | 49.7% |
| Mean | 26.7% | 14.5% |
| Median | 19.2% | 12.5% |
| Interquartile 25% (IQ1) | 15.3% | 8.9% |
| Interquartile 75% (IQ3) | 33.3% | 16.8% |
| Interquartile Range (IQR) | 18.0% | 7.9% |
| Standard Deviation (Sample) | 16.6% | 9.3% |
| Standard Deviation (Population) | 16.2% | 9.2% |
Similar Demographics by Single Male Poverty
Demographics Similar to French American Indians by Single Male Poverty
In terms of single male poverty, the demographic groups most similar to French American Indians are Delaware (15.0%, a difference of 0.39%), Cree (15.1%, a difference of 0.84%), Immigrants from Dominican Republic (14.8%, a difference of 1.3%), African (14.7%, a difference of 1.6%), and Dominican (15.2%, a difference of 1.7%).
| Demographics | Rating | Rank | Single Male Poverty |
| Bahamians | 0.0 /100 | #291 | Tragic 14.6% |
| Immigrants | Nonimmigrants | 0.0 /100 | #292 | Tragic 14.6% |
| French Canadians | 0.0 /100 | #293 | Tragic 14.6% |
| Ottawa | 0.0 /100 | #294 | Tragic 14.6% |
| Scotch-Irish | 0.0 /100 | #295 | Tragic 14.7% |
| Africans | 0.0 /100 | #296 | Tragic 14.7% |
| Immigrants | Dominican Republic | 0.0 /100 | #297 | Tragic 14.8% |
| French American Indians | 0.0 /100 | #298 | Tragic 15.0% |
| Delaware | 0.0 /100 | #299 | Tragic 15.0% |
| Cree | 0.0 /100 | #300 | Tragic 15.1% |
| Dominicans | 0.0 /100 | #301 | Tragic 15.2% |
| Alsatians | 0.0 /100 | #302 | Tragic 15.2% |
| Aleuts | 0.0 /100 | #303 | Tragic 15.4% |
| Alaska Natives | 0.0 /100 | #304 | Tragic 15.4% |
| Blackfeet | 0.0 /100 | #305 | Tragic 15.5% |
Demographics Similar to Sierra Leoneans by Single Male Poverty
In terms of single male poverty, the demographic groups most similar to Sierra Leoneans are Immigrants from Panama (12.6%, a difference of 0.060%), Yugoslavian (12.6%, a difference of 0.070%), Immigrants from Hungary (12.6%, a difference of 0.070%), Australian (12.6%, a difference of 0.11%), and Malaysian (12.6%, a difference of 0.12%).
| Demographics | Rating | Rank | Single Male Poverty |
| Immigrants | Uganda | 75.9 /100 | #142 | Good 12.6% |
| Immigrants | France | 75.8 /100 | #143 | Good 12.6% |
| Hawaiians | 75.1 /100 | #144 | Good 12.6% |
| Immigrants | Lebanon | 75.0 /100 | #145 | Good 12.6% |
| Native Hawaiians | 75.0 /100 | #146 | Good 12.6% |
| Malaysians | 74.8 /100 | #147 | Good 12.6% |
| Yugoslavians | 73.9 /100 | #148 | Good 12.6% |
| Sierra Leoneans | 73.0 /100 | #149 | Good 12.6% |
| Immigrants | Panama | 72.1 /100 | #150 | Good 12.6% |
| Immigrants | Hungary | 71.9 /100 | #151 | Good 12.6% |
| Australians | 71.4 /100 | #152 | Good 12.6% |
| Immigrants | Immigrants | 70.1 /100 | #153 | Good 12.7% |
| Immigrants | Scotland | 68.9 /100 | #154 | Good 12.7% |
| Immigrants | Spain | 68.7 /100 | #155 | Good 12.7% |
| Vietnamese | 67.9 /100 | #156 | Good 12.7% |