Finnish vs Shoshone Seniors Poverty Over the Age of 65
COMPARE
Finnish
Shoshone
Seniors Poverty Over the Age of 65
Seniors Poverty Over the Age of 65 Comparison
Finns
Shoshone
9.4%
SENIORS POVERTY OVER THE AGE OF 65
99.8/ 100
METRIC RATING
31st/ 347
METRIC RANK
12.3%
SENIORS POVERTY OVER THE AGE OF 65
0.3/ 100
METRIC RATING
253rd/ 347
METRIC RANK
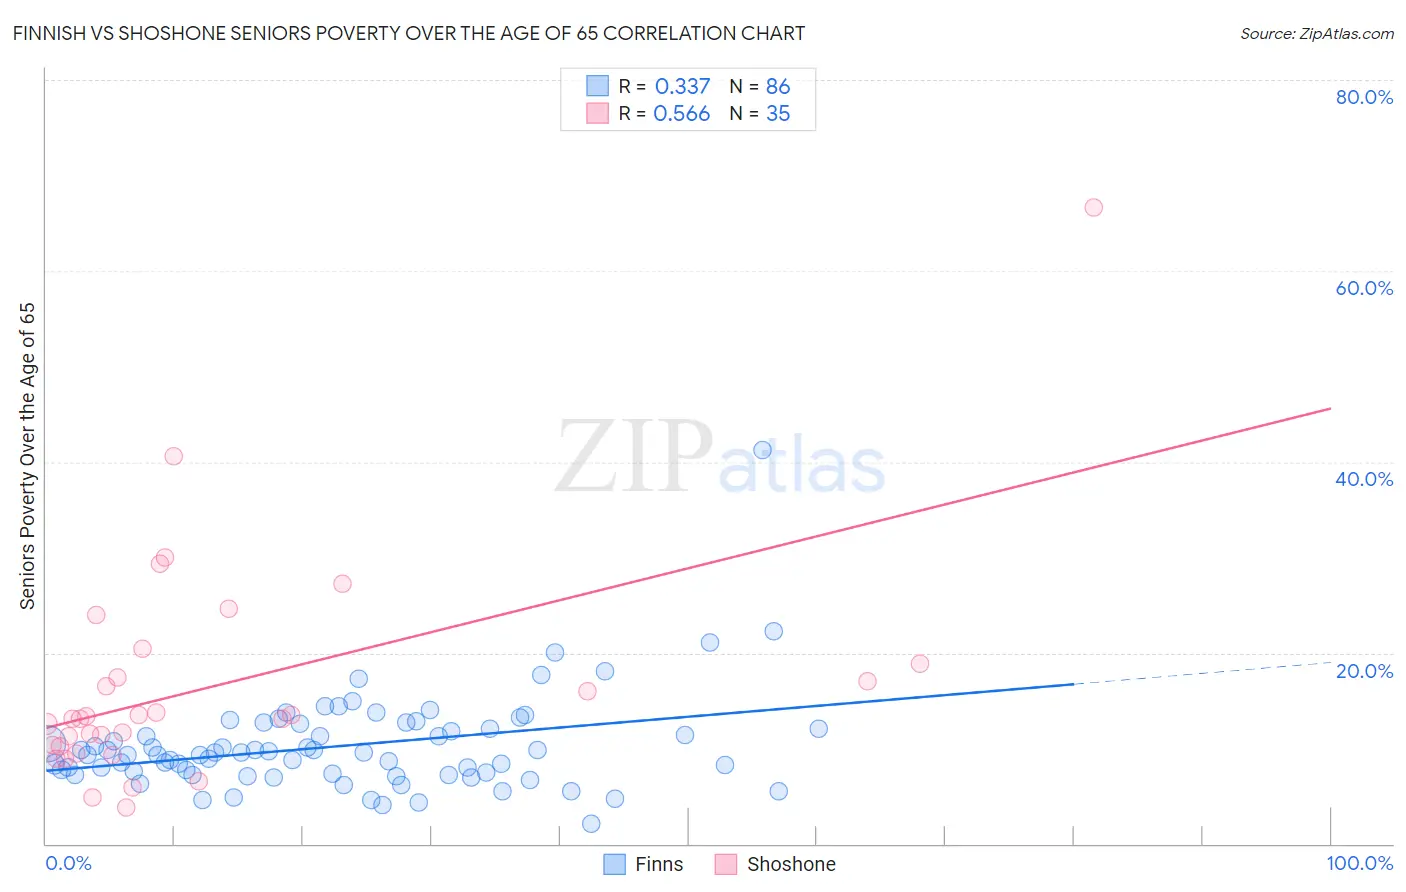
Finnish vs Shoshone Seniors Poverty Over the Age of 65 Correlation Chart
The statistical analysis conducted on geographies consisting of 403,117,006 people shows a mild positive correlation between the proportion of Finns and poverty level among seniors over the age of 65 in the United States with a correlation coefficient (R) of 0.337 and weighted average of 9.4%. Similarly, the statistical analysis conducted on geographies consisting of 66,580,086 people shows a substantial positive correlation between the proportion of Shoshone and poverty level among seniors over the age of 65 in the United States with a correlation coefficient (R) of 0.566 and weighted average of 12.3%, a difference of 31.6%.
Seniors Poverty Over the Age of 65 Correlation Summary
| Measurement | Finnish | Shoshone |
| Minimum | 2.1% | 3.8% |
| Maximum | 41.3% | 66.7% |
| Range | 39.2% | 62.9% |
| Mean | 10.3% | 16.5% |
| Median | 9.4% | 13.1% |
| Interquartile 25% (IQ1) | 7.4% | 10.3% |
| Interquartile 75% (IQ3) | 12.1% | 18.8% |
| Interquartile Range (IQR) | 4.7% | 8.6% |
| Standard Deviation (Sample) | 5.1% | 11.8% |
| Standard Deviation (Population) | 5.1% | 11.6% |
Similar Demographics by Seniors Poverty Over the Age of 65
Demographics Similar to Finns by Seniors Poverty Over the Age of 65
In terms of seniors poverty over the age of 65, the demographic groups most similar to Finns are Menominee (9.4%, a difference of 0.22%), Northern European (9.4%, a difference of 0.28%), Native Hawaiian (9.4%, a difference of 0.30%), Bhutanese (9.3%, a difference of 0.37%), and British (9.4%, a difference of 0.40%).
| Demographics | Rating | Rank | Seniors Poverty Over the Age of 65 |
| Bulgarians | 99.9 /100 | #24 | Exceptional 9.3% |
| Irish | 99.9 /100 | #25 | Exceptional 9.3% |
| Immigrants | Scotland | 99.9 /100 | #26 | Exceptional 9.3% |
| Italians | 99.9 /100 | #27 | Exceptional 9.3% |
| Tongans | 99.9 /100 | #28 | Exceptional 9.3% |
| Bhutanese | 99.9 /100 | #29 | Exceptional 9.3% |
| Menominee | 99.8 /100 | #30 | Exceptional 9.4% |
| Finns | 99.8 /100 | #31 | Exceptional 9.4% |
| Northern Europeans | 99.8 /100 | #32 | Exceptional 9.4% |
| Native Hawaiians | 99.8 /100 | #33 | Exceptional 9.4% |
| British | 99.8 /100 | #34 | Exceptional 9.4% |
| Latvians | 99.8 /100 | #35 | Exceptional 9.5% |
| Czechoslovakians | 99.8 /100 | #36 | Exceptional 9.5% |
| Scotch-Irish | 99.7 /100 | #37 | Exceptional 9.5% |
| Belgians | 99.7 /100 | #38 | Exceptional 9.5% |
Demographics Similar to Shoshone by Seniors Poverty Over the Age of 65
In terms of seniors poverty over the age of 65, the demographic groups most similar to Shoshone are Armenian (12.3%, a difference of 0.13%), Immigrants from Cambodia (12.4%, a difference of 0.22%), Somali (12.3%, a difference of 0.24%), Mexican American Indian (12.4%, a difference of 0.34%), and Immigrants from Panama (12.4%, a difference of 0.58%).
| Demographics | Rating | Rank | Seniors Poverty Over the Age of 65 |
| Cree | 0.7 /100 | #246 | Tragic 12.1% |
| Japanese | 0.6 /100 | #247 | Tragic 12.2% |
| Spanish Americans | 0.6 /100 | #248 | Tragic 12.2% |
| Ute | 0.6 /100 | #249 | Tragic 12.2% |
| Immigrants | Liberia | 0.5 /100 | #250 | Tragic 12.2% |
| Somalis | 0.3 /100 | #251 | Tragic 12.3% |
| Armenians | 0.3 /100 | #252 | Tragic 12.3% |
| Shoshone | 0.3 /100 | #253 | Tragic 12.3% |
| Immigrants | Cambodia | 0.3 /100 | #254 | Tragic 12.4% |
| Mexican American Indians | 0.3 /100 | #255 | Tragic 12.4% |
| Immigrants | Panama | 0.2 /100 | #256 | Tragic 12.4% |
| Immigrants | Immigrants | 0.2 /100 | #257 | Tragic 12.4% |
| Dutch West Indians | 0.2 /100 | #258 | Tragic 12.4% |
| Ghanaians | 0.2 /100 | #259 | Tragic 12.4% |
| South Americans | 0.2 /100 | #260 | Tragic 12.5% |