Armenian vs Immigrants from Fiji Seniors Poverty Over the Age of 65
COMPARE
Armenian
Immigrants from Fiji
Seniors Poverty Over the Age of 65
Seniors Poverty Over the Age of 65 Comparison
Armenians
Immigrants from Fiji
12.3%
SENIORS POVERTY OVER THE AGE OF 65
0.3/ 100
METRIC RATING
252nd/ 347
METRIC RANK
11.0%
SENIORS POVERTY OVER THE AGE OF 65
42.0/ 100
METRIC RATING
182nd/ 347
METRIC RANK
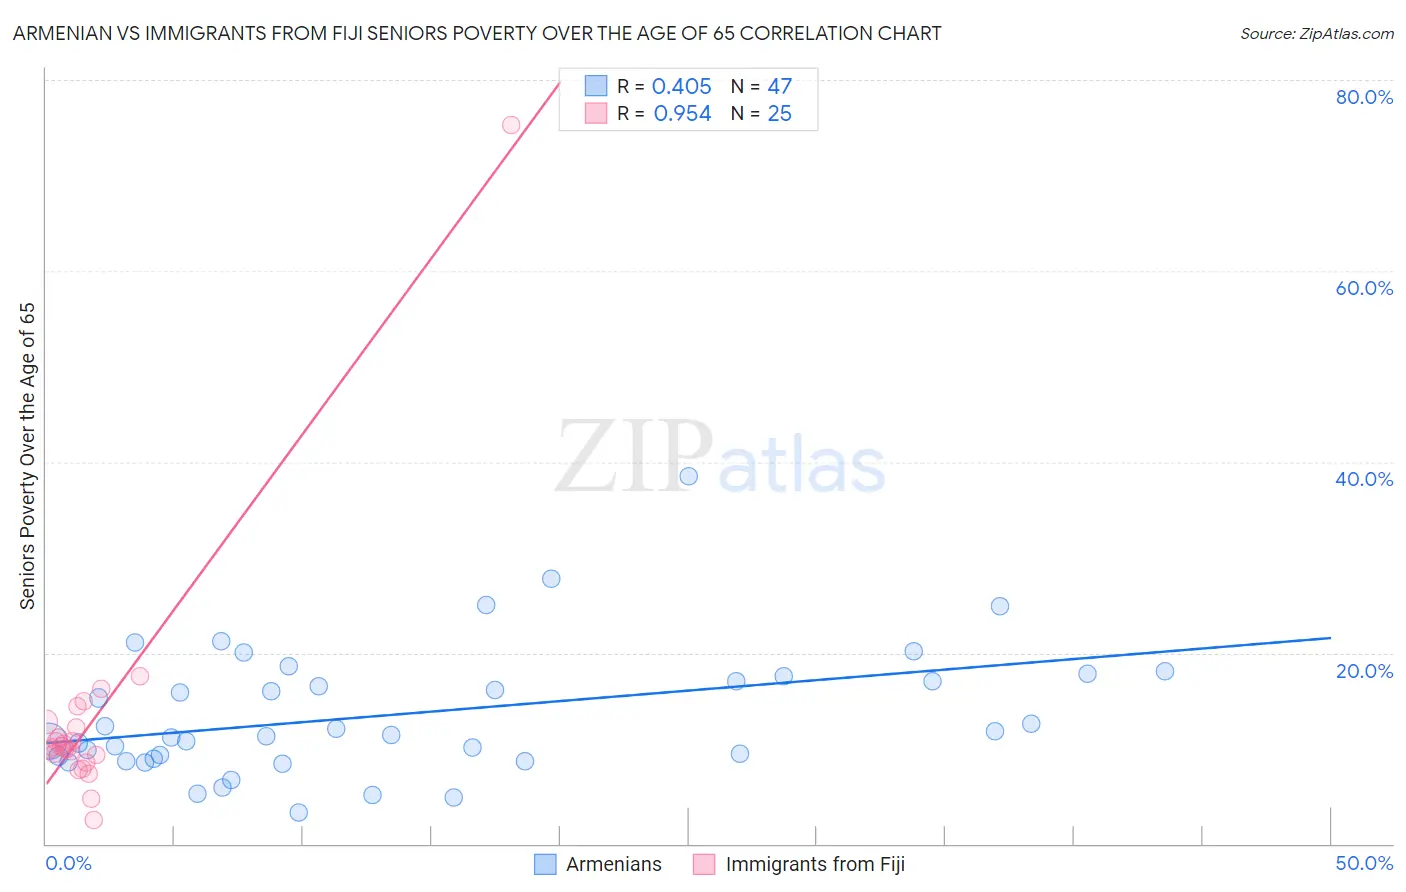
Armenian vs Immigrants from Fiji Seniors Poverty Over the Age of 65 Correlation Chart
The statistical analysis conducted on geographies consisting of 310,185,969 people shows a moderate positive correlation between the proportion of Armenians and poverty level among seniors over the age of 65 in the United States with a correlation coefficient (R) of 0.405 and weighted average of 12.3%. Similarly, the statistical analysis conducted on geographies consisting of 93,720,826 people shows a perfect positive correlation between the proportion of Immigrants from Fiji and poverty level among seniors over the age of 65 in the United States with a correlation coefficient (R) of 0.954 and weighted average of 11.0%, a difference of 11.9%.
Seniors Poverty Over the Age of 65 Correlation Summary
| Measurement | Armenian | Immigrants from Fiji |
| Minimum | 3.3% | 2.5% |
| Maximum | 38.5% | 75.3% |
| Range | 35.2% | 72.8% |
| Mean | 13.6% | 12.9% |
| Median | 11.4% | 10.1% |
| Interquartile 25% (IQ1) | 8.9% | 8.9% |
| Interquartile 75% (IQ3) | 17.6% | 12.5% |
| Interquartile Range (IQR) | 8.7% | 3.6% |
| Standard Deviation (Sample) | 6.8% | 13.4% |
| Standard Deviation (Population) | 6.7% | 13.1% |
Similar Demographics by Seniors Poverty Over the Age of 65
Demographics Similar to Armenians by Seniors Poverty Over the Age of 65
In terms of seniors poverty over the age of 65, the demographic groups most similar to Armenians are Somali (12.3%, a difference of 0.11%), Shoshone (12.3%, a difference of 0.13%), Immigrants from Cambodia (12.4%, a difference of 0.35%), Mexican American Indian (12.4%, a difference of 0.48%), and Immigrants from Panama (12.4%, a difference of 0.71%).
| Demographics | Rating | Rank | Seniors Poverty Over the Age of 65 |
| Chippewa | 0.7 /100 | #245 | Tragic 12.1% |
| Cree | 0.7 /100 | #246 | Tragic 12.1% |
| Japanese | 0.6 /100 | #247 | Tragic 12.2% |
| Spanish Americans | 0.6 /100 | #248 | Tragic 12.2% |
| Ute | 0.6 /100 | #249 | Tragic 12.2% |
| Immigrants | Liberia | 0.5 /100 | #250 | Tragic 12.2% |
| Somalis | 0.3 /100 | #251 | Tragic 12.3% |
| Armenians | 0.3 /100 | #252 | Tragic 12.3% |
| Shoshone | 0.3 /100 | #253 | Tragic 12.3% |
| Immigrants | Cambodia | 0.3 /100 | #254 | Tragic 12.4% |
| Mexican American Indians | 0.3 /100 | #255 | Tragic 12.4% |
| Immigrants | Panama | 0.2 /100 | #256 | Tragic 12.4% |
| Immigrants | Immigrants | 0.2 /100 | #257 | Tragic 12.4% |
| Dutch West Indians | 0.2 /100 | #258 | Tragic 12.4% |
| Ghanaians | 0.2 /100 | #259 | Tragic 12.4% |
Demographics Similar to Immigrants from Fiji by Seniors Poverty Over the Age of 65
In terms of seniors poverty over the age of 65, the demographic groups most similar to Immigrants from Fiji are Immigrants from Kazakhstan (11.0%, a difference of 0.090%), Immigrants from France (11.0%, a difference of 0.10%), Immigrants from Thailand (11.0%, a difference of 0.13%), Immigrants from Eastern Africa (11.0%, a difference of 0.13%), and Immigrants from Northern Africa (11.0%, a difference of 0.23%).
| Demographics | Rating | Rank | Seniors Poverty Over the Age of 65 |
| Creek | 49.6 /100 | #175 | Average 10.9% |
| Immigrants | Malaysia | 47.9 /100 | #176 | Average 11.0% |
| Cherokee | 47.3 /100 | #177 | Average 11.0% |
| German Russians | 46.9 /100 | #178 | Average 11.0% |
| Immigrants | Northern Africa | 44.6 /100 | #179 | Average 11.0% |
| Immigrants | Thailand | 43.5 /100 | #180 | Average 11.0% |
| Immigrants | Eastern Africa | 43.4 /100 | #181 | Average 11.0% |
| Immigrants | Fiji | 42.0 /100 | #182 | Average 11.0% |
| Immigrants | Kazakhstan | 41.0 /100 | #183 | Average 11.0% |
| Immigrants | France | 40.9 /100 | #184 | Average 11.0% |
| Immigrants | Lebanon | 38.2 /100 | #185 | Fair 11.1% |
| Immigrants | Eastern Asia | 37.5 /100 | #186 | Fair 11.1% |
| Immigrants | Middle Africa | 37.4 /100 | #187 | Fair 11.1% |
| Immigrants | Hong Kong | 36.3 /100 | #188 | Fair 11.1% |
| Immigrants | Laos | 35.7 /100 | #189 | Fair 11.1% |