Finnish vs Alsatian Female Poverty Among 18-24 Year Olds
COMPARE
Finnish
Alsatian
Female Poverty Among 18-24 Year Olds
Female Poverty Among 18-24 Year Olds Comparison
Finns
Alsatians
20.8%
FEMALE POVERTY AMONG 18-24 YEAR OLDS
6.0/ 100
METRIC RATING
232nd/ 347
METRIC RANK
24.4%
FEMALE POVERTY AMONG 18-24 YEAR OLDS
0.0/ 100
METRIC RATING
316th/ 347
METRIC RANK
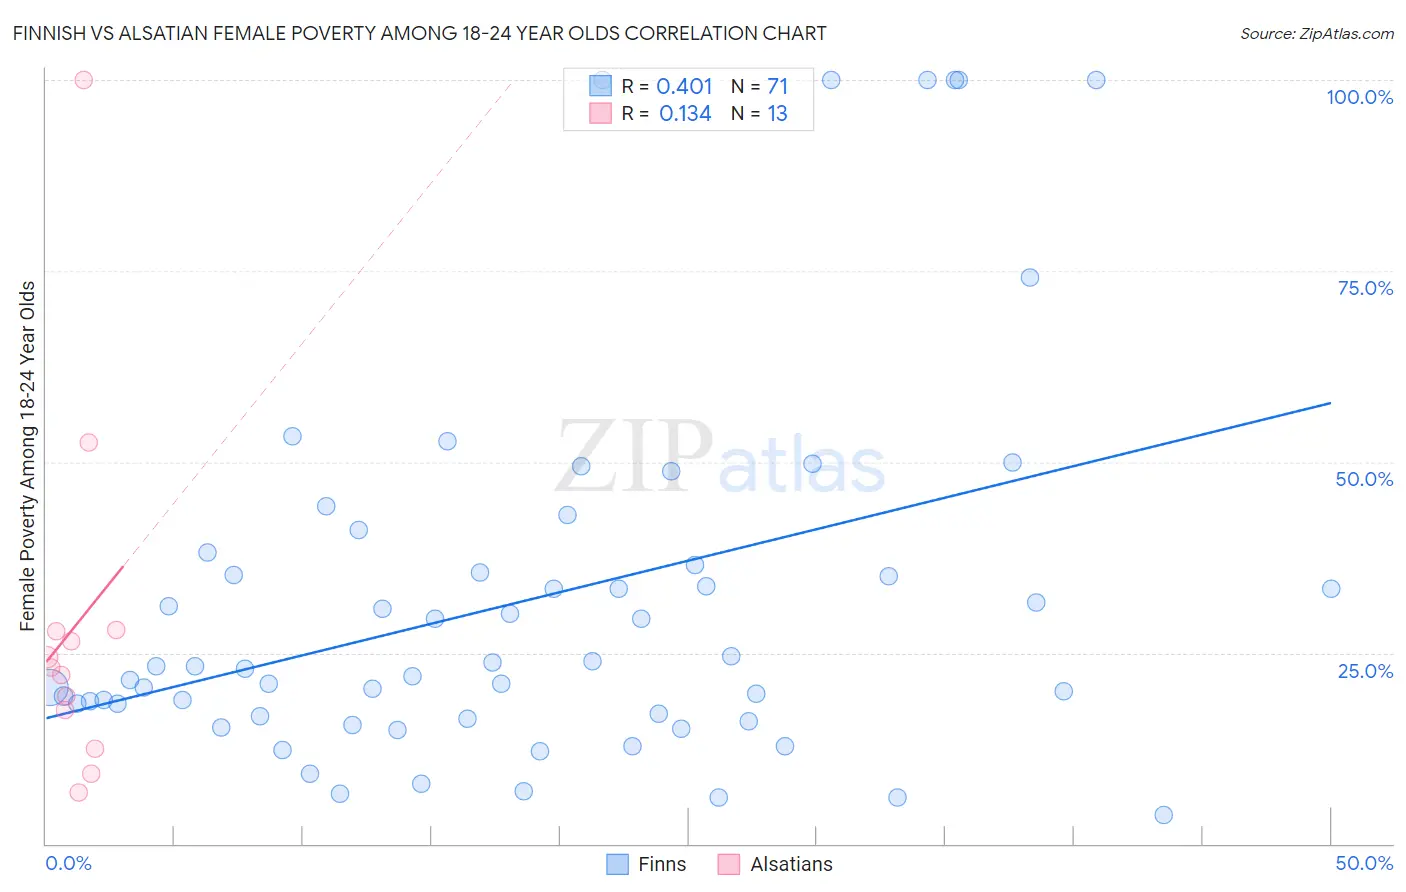
Finnish vs Alsatian Female Poverty Among 18-24 Year Olds Correlation Chart
The statistical analysis conducted on geographies consisting of 390,891,764 people shows a moderate positive correlation between the proportion of Finns and poverty level among females between the ages 18 and 24 in the United States with a correlation coefficient (R) of 0.401 and weighted average of 20.8%. Similarly, the statistical analysis conducted on geographies consisting of 81,760,861 people shows a poor positive correlation between the proportion of Alsatians and poverty level among females between the ages 18 and 24 in the United States with a correlation coefficient (R) of 0.134 and weighted average of 24.4%, a difference of 17.4%.
Female Poverty Among 18-24 Year Olds Correlation Summary
| Measurement | Finnish | Alsatian |
| Minimum | 3.8% | 6.7% |
| Maximum | 100.0% | 100.0% |
| Range | 96.2% | 93.3% |
| Mean | 31.9% | 28.4% |
| Median | 23.2% | 23.1% |
| Interquartile 25% (IQ1) | 16.7% | 15.0% |
| Interquartile 75% (IQ3) | 36.5% | 27.9% |
| Interquartile Range (IQR) | 19.8% | 12.9% |
| Standard Deviation (Sample) | 24.7% | 24.3% |
| Standard Deviation (Population) | 24.6% | 23.3% |
Similar Demographics by Female Poverty Among 18-24 Year Olds
Demographics Similar to Finns by Female Poverty Among 18-24 Year Olds
In terms of female poverty among 18-24 year olds, the demographic groups most similar to Finns are Immigrants from St. Vincent and the Grenadines (20.8%, a difference of 0.0%), Australian (20.8%, a difference of 0.030%), White/Caucasian (20.8%, a difference of 0.030%), Immigrants from Denmark (20.8%, a difference of 0.030%), and Ghanaian (20.8%, a difference of 0.10%).
| Demographics | Rating | Rank | Female Poverty Among 18-24 Year Olds |
| Norwegians | 7.3 /100 | #225 | Tragic 20.7% |
| Estonians | 7.2 /100 | #226 | Tragic 20.7% |
| Immigrants | Sweden | 6.8 /100 | #227 | Tragic 20.7% |
| Ghanaians | 6.5 /100 | #228 | Tragic 20.8% |
| Australians | 6.1 /100 | #229 | Tragic 20.8% |
| Whites/Caucasians | 6.1 /100 | #230 | Tragic 20.8% |
| Immigrants | St. Vincent and the Grenadines | 6.0 /100 | #231 | Tragic 20.8% |
| Finns | 6.0 /100 | #232 | Tragic 20.8% |
| Immigrants | Denmark | 5.8 /100 | #233 | Tragic 20.8% |
| Welsh | 5.4 /100 | #234 | Tragic 20.8% |
| Immigrants | Uganda | 5.1 /100 | #235 | Tragic 20.8% |
| Okinawans | 4.9 /100 | #236 | Tragic 20.8% |
| Scottish | 4.5 /100 | #237 | Tragic 20.9% |
| Immigrants | Singapore | 4.4 /100 | #238 | Tragic 20.9% |
| Immigrants | Guatemala | 4.3 /100 | #239 | Tragic 20.9% |
Demographics Similar to Alsatians by Female Poverty Among 18-24 Year Olds
In terms of female poverty among 18-24 year olds, the demographic groups most similar to Alsatians are Osage (24.5%, a difference of 0.29%), Black/African American (24.3%, a difference of 0.31%), Chickasaw (24.5%, a difference of 0.38%), Dutch West Indian (24.5%, a difference of 0.48%), and Choctaw (24.3%, a difference of 0.51%).
| Demographics | Rating | Rank | Female Poverty Among 18-24 Year Olds |
| Blackfeet | 0.0 /100 | #309 | Tragic 23.6% |
| Comanche | 0.0 /100 | #310 | Tragic 23.6% |
| Potawatomi | 0.0 /100 | #311 | Tragic 23.7% |
| Yuman | 0.0 /100 | #312 | Tragic 24.0% |
| Creek | 0.0 /100 | #313 | Tragic 24.2% |
| Choctaw | 0.0 /100 | #314 | Tragic 24.3% |
| Blacks/African Americans | 0.0 /100 | #315 | Tragic 24.3% |
| Alsatians | 0.0 /100 | #316 | Tragic 24.4% |
| Osage | 0.0 /100 | #317 | Tragic 24.5% |
| Chickasaw | 0.0 /100 | #318 | Tragic 24.5% |
| Dutch West Indians | 0.0 /100 | #319 | Tragic 24.5% |
| Immigrants | Congo | 0.0 /100 | #320 | Tragic 24.6% |
| Immigrants | Zaire | 0.0 /100 | #321 | Tragic 25.1% |
| Somalis | 0.0 /100 | #322 | Tragic 25.1% |
| Arapaho | 0.0 /100 | #323 | Tragic 25.2% |