Czechoslovakian vs Immigrants from Cambodia Poverty
COMPARE
Czechoslovakian
Immigrants from Cambodia
Poverty
Poverty Comparison
Czechoslovakians
Immigrants from Cambodia
11.4%
POVERTY
95.7/ 100
METRIC RATING
89th/ 347
METRIC RANK
13.4%
POVERTY
3.0/ 100
METRIC RATING
219th/ 347
METRIC RANK
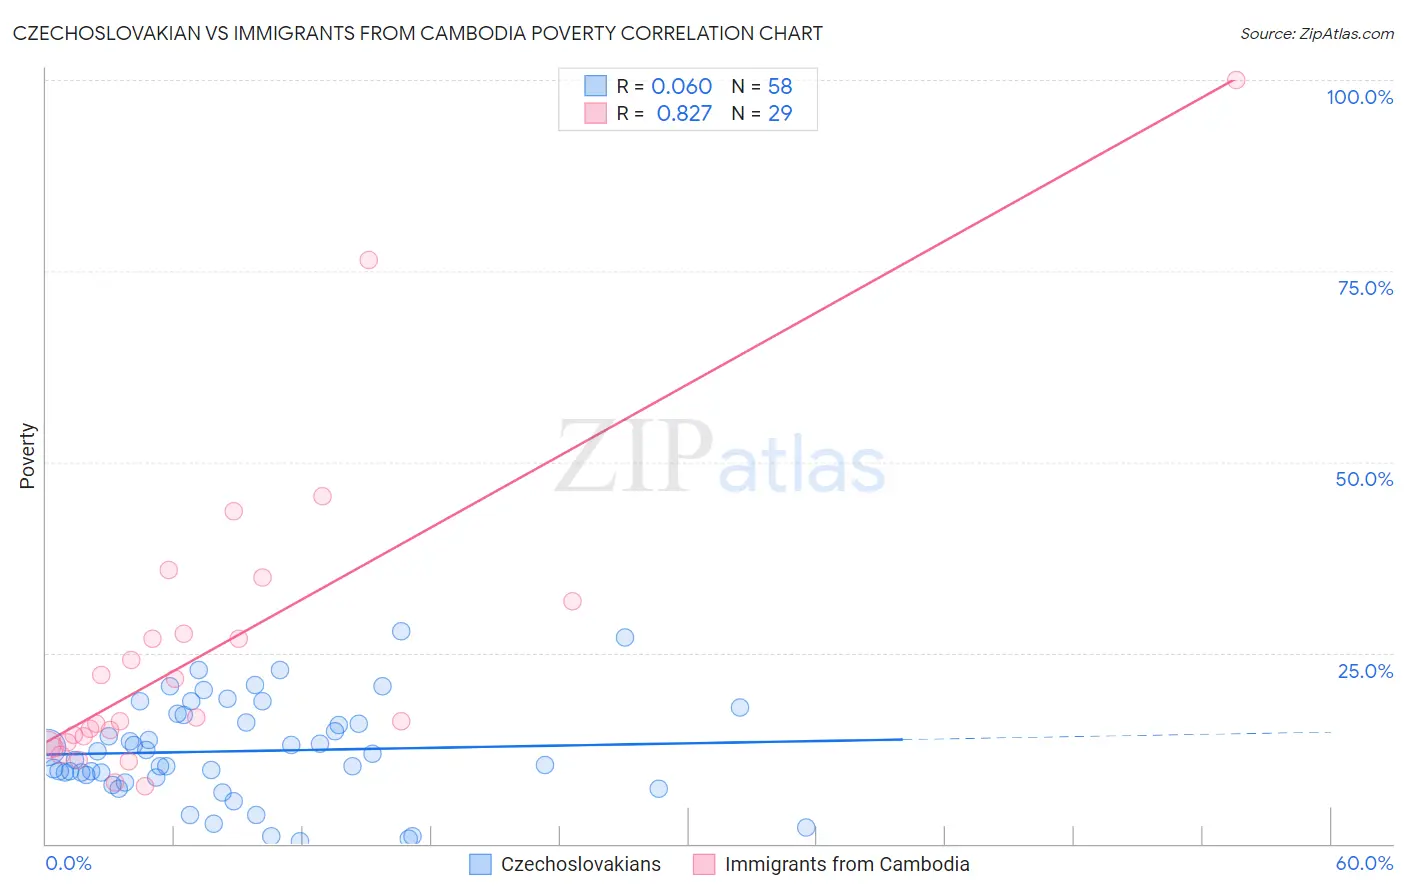
Czechoslovakian vs Immigrants from Cambodia Poverty Correlation Chart
The statistical analysis conducted on geographies consisting of 368,518,810 people shows a slight positive correlation between the proportion of Czechoslovakians and poverty level in the United States with a correlation coefficient (R) of 0.060 and weighted average of 11.4%. Similarly, the statistical analysis conducted on geographies consisting of 205,130,187 people shows a very strong positive correlation between the proportion of Immigrants from Cambodia and poverty level in the United States with a correlation coefficient (R) of 0.827 and weighted average of 13.4%, a difference of 17.3%.
Poverty Correlation Summary
| Measurement | Czechoslovakian | Immigrants from Cambodia |
| Minimum | 0.33% | 7.5% |
| Maximum | 27.8% | 100.0% |
| Range | 27.5% | 92.5% |
| Mean | 12.1% | 25.1% |
| Median | 11.4% | 16.0% |
| Interquartile 25% (IQ1) | 8.7% | 13.1% |
| Interquartile 75% (IQ3) | 16.8% | 29.7% |
| Interquartile Range (IQR) | 8.1% | 16.6% |
| Standard Deviation (Sample) | 6.5% | 20.4% |
| Standard Deviation (Population) | 6.4% | 20.1% |
Similar Demographics by Poverty
Demographics Similar to Czechoslovakians by Poverty
In terms of poverty, the demographic groups most similar to Czechoslovakians are Belgian (11.4%, a difference of 0.040%), Immigrants from Denmark (11.4%, a difference of 0.17%), Jordanian (11.4%, a difference of 0.18%), Northern European (11.4%, a difference of 0.18%), and Immigrants from England (11.4%, a difference of 0.30%).
| Demographics | Rating | Rank | Poverty |
| Egyptians | 96.5 /100 | #82 | Exceptional 11.3% |
| Immigrants | Sweden | 96.3 /100 | #83 | Exceptional 11.3% |
| English | 96.3 /100 | #84 | Exceptional 11.3% |
| Immigrants | England | 96.2 /100 | #85 | Exceptional 11.4% |
| Jordanians | 96.0 /100 | #86 | Exceptional 11.4% |
| Northern Europeans | 96.0 /100 | #87 | Exceptional 11.4% |
| Belgians | 95.8 /100 | #88 | Exceptional 11.4% |
| Czechoslovakians | 95.7 /100 | #89 | Exceptional 11.4% |
| Immigrants | Denmark | 95.5 /100 | #90 | Exceptional 11.4% |
| Finns | 95.2 /100 | #91 | Exceptional 11.4% |
| British | 95.0 /100 | #92 | Exceptional 11.4% |
| Romanians | 94.9 /100 | #93 | Exceptional 11.4% |
| Paraguayans | 94.9 /100 | #94 | Exceptional 11.4% |
| Australians | 94.9 /100 | #95 | Exceptional 11.4% |
| Immigrants | South Africa | 94.7 /100 | #96 | Exceptional 11.5% |
Demographics Similar to Immigrants from Cambodia by Poverty
In terms of poverty, the demographic groups most similar to Immigrants from Cambodia are American (13.4%, a difference of 0.090%), Immigrants from Thailand (13.3%, a difference of 0.12%), Immigrants from Uzbekistan (13.3%, a difference of 0.19%), Japanese (13.3%, a difference of 0.23%), and Nonimmigrants (13.3%, a difference of 0.23%).
| Demographics | Rating | Rank | Poverty |
| Immigrants | Immigrants | 4.3 /100 | #212 | Tragic 13.2% |
| Immigrants | Panama | 4.1 /100 | #213 | Tragic 13.3% |
| Bermudans | 3.7 /100 | #214 | Tragic 13.3% |
| Japanese | 3.3 /100 | #215 | Tragic 13.3% |
| Immigrants | Nonimmigrants | 3.3 /100 | #216 | Tragic 13.3% |
| Immigrants | Uzbekistan | 3.2 /100 | #217 | Tragic 13.3% |
| Immigrants | Thailand | 3.1 /100 | #218 | Tragic 13.3% |
| Immigrants | Cambodia | 3.0 /100 | #219 | Tragic 13.4% |
| Americans | 2.9 /100 | #220 | Tragic 13.4% |
| Alsatians | 2.6 /100 | #221 | Tragic 13.4% |
| Immigrants | Micronesia | 2.6 /100 | #222 | Tragic 13.4% |
| Immigrants | Africa | 2.5 /100 | #223 | Tragic 13.4% |
| Immigrants | Eritrea | 2.4 /100 | #224 | Tragic 13.4% |
| German Russians | 2.2 /100 | #225 | Tragic 13.4% |
| Marshallese | 2.2 /100 | #226 | Tragic 13.4% |