European vs Immigrants from Bahamas Male Poverty
COMPARE
European
Immigrants from Bahamas
Male Poverty
Male Poverty Comparison
Europeans
Immigrants from Bahamas
10.2%
MALE POVERTY
97.1/ 100
METRIC RATING
71st/ 347
METRIC RANK
13.5%
MALE POVERTY
0.0/ 100
METRIC RATING
272nd/ 347
METRIC RANK
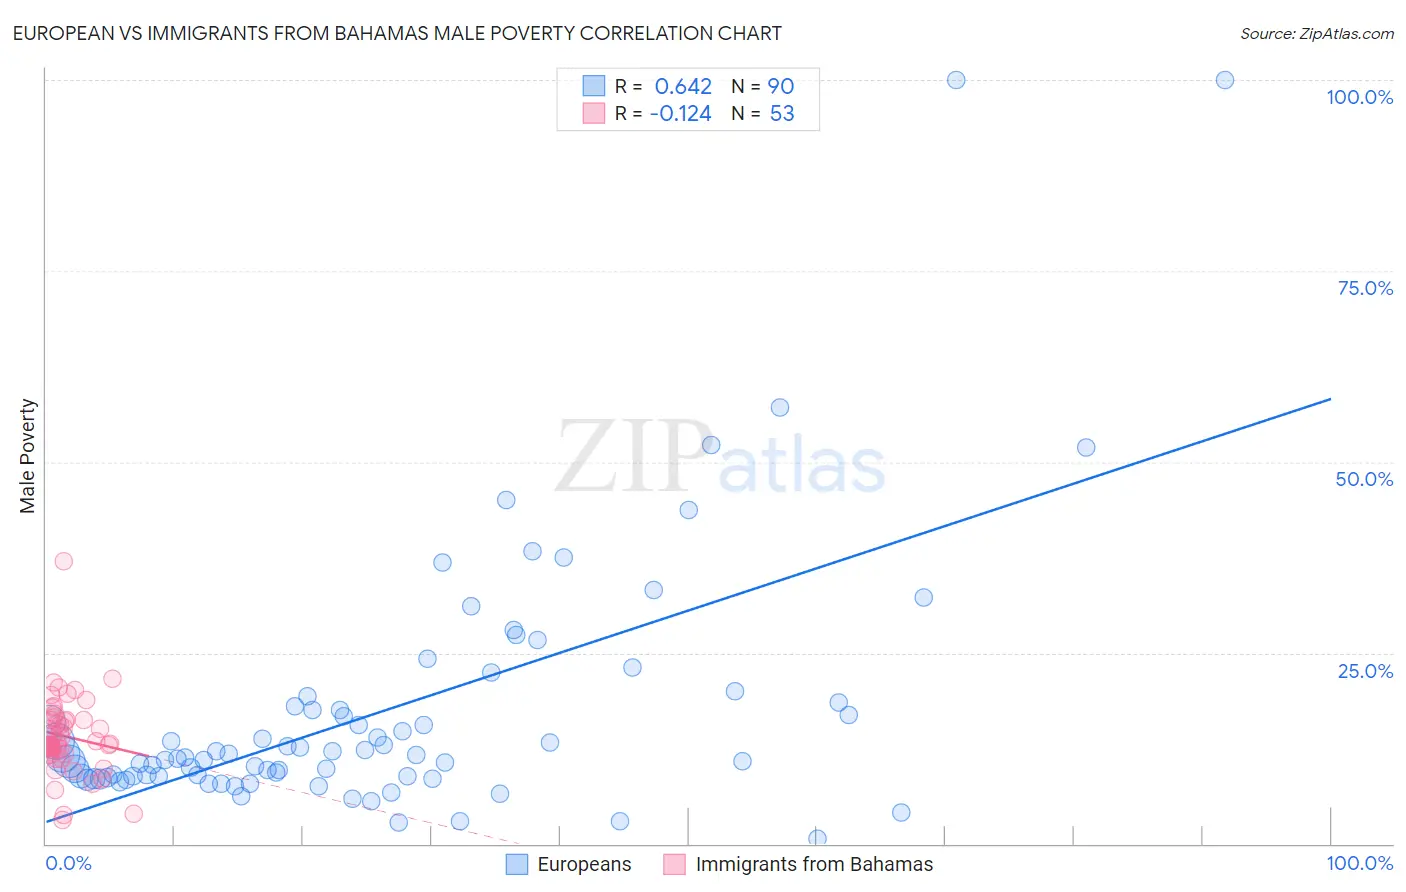
European vs Immigrants from Bahamas Male Poverty Correlation Chart
The statistical analysis conducted on geographies consisting of 560,421,320 people shows a significant positive correlation between the proportion of Europeans and poverty level among males in the United States with a correlation coefficient (R) of 0.642 and weighted average of 10.2%. Similarly, the statistical analysis conducted on geographies consisting of 104,609,154 people shows a poor negative correlation between the proportion of Immigrants from Bahamas and poverty level among males in the United States with a correlation coefficient (R) of -0.124 and weighted average of 13.5%, a difference of 31.5%.
Male Poverty Correlation Summary
| Measurement | European | Immigrants from Bahamas |
| Minimum | 0.73% | 3.1% |
| Maximum | 100.0% | 37.0% |
| Range | 99.3% | 33.9% |
| Mean | 17.4% | 14.0% |
| Median | 11.4% | 13.0% |
| Interquartile 25% (IQ1) | 8.8% | 11.9% |
| Interquartile 75% (IQ3) | 18.1% | 16.2% |
| Interquartile Range (IQR) | 9.3% | 4.3% |
| Standard Deviation (Sample) | 17.0% | 5.2% |
| Standard Deviation (Population) | 16.9% | 5.2% |
Similar Demographics by Male Poverty
Demographics Similar to Europeans by Male Poverty
In terms of male poverty, the demographic groups most similar to Europeans are Immigrants from Canada (10.2%, a difference of 0.010%), Paraguayan (10.2%, a difference of 0.030%), Immigrants from Australia (10.2%, a difference of 0.040%), Immigrants from Asia (10.2%, a difference of 0.090%), and Immigrants from Eastern Europe (10.2%, a difference of 0.16%).
| Demographics | Rating | Rank | Male Poverty |
| Swiss | 97.5 /100 | #64 | Exceptional 10.2% |
| Zimbabweans | 97.5 /100 | #65 | Exceptional 10.2% |
| Serbians | 97.5 /100 | #66 | Exceptional 10.2% |
| Immigrants | Netherlands | 97.3 /100 | #67 | Exceptional 10.2% |
| Immigrants | Sri Lanka | 97.2 /100 | #68 | Exceptional 10.2% |
| Immigrants | Australia | 97.1 /100 | #69 | Exceptional 10.2% |
| Paraguayans | 97.1 /100 | #70 | Exceptional 10.2% |
| Europeans | 97.1 /100 | #71 | Exceptional 10.2% |
| Immigrants | Canada | 97.1 /100 | #72 | Exceptional 10.2% |
| Immigrants | Asia | 97.0 /100 | #73 | Exceptional 10.2% |
| Immigrants | Eastern Europe | 96.9 /100 | #74 | Exceptional 10.2% |
| Carpatho Rusyns | 96.9 /100 | #75 | Exceptional 10.2% |
| Dutch | 96.9 /100 | #76 | Exceptional 10.2% |
| Immigrants | Belgium | 96.8 /100 | #77 | Exceptional 10.3% |
| Irish | 96.8 /100 | #78 | Exceptional 10.3% |
Demographics Similar to Immigrants from Bahamas by Male Poverty
In terms of male poverty, the demographic groups most similar to Immigrants from Bahamas are Chickasaw (13.5%, a difference of 0.29%), Immigrants from West Indies (13.5%, a difference of 0.37%), Spanish American (13.4%, a difference of 0.75%), Cree (13.3%, a difference of 0.78%), and Barbadian (13.6%, a difference of 0.99%).
| Demographics | Rating | Rank | Male Poverty |
| Jamaicans | 0.1 /100 | #265 | Tragic 13.2% |
| Immigrants | Guyana | 0.1 /100 | #266 | Tragic 13.2% |
| Immigrants | Jamaica | 0.1 /100 | #267 | Tragic 13.3% |
| Sub-Saharan Africans | 0.1 /100 | #268 | Tragic 13.3% |
| Guyanese | 0.0 /100 | #269 | Tragic 13.3% |
| Cree | 0.0 /100 | #270 | Tragic 13.3% |
| Spanish Americans | 0.0 /100 | #271 | Tragic 13.4% |
| Immigrants | Bahamas | 0.0 /100 | #272 | Tragic 13.5% |
| Chickasaw | 0.0 /100 | #273 | Tragic 13.5% |
| Immigrants | West Indies | 0.0 /100 | #274 | Tragic 13.5% |
| Barbadians | 0.0 /100 | #275 | Tragic 13.6% |
| Immigrants | Latin America | 0.0 /100 | #276 | Tragic 13.6% |
| Bangladeshis | 0.0 /100 | #277 | Tragic 13.6% |
| Belizeans | 0.0 /100 | #278 | Tragic 13.6% |
| Haitians | 0.0 /100 | #279 | Tragic 13.7% |