European vs Honduran Unemployment
COMPARE
European
Honduran
Unemployment
Unemployment Comparison
Europeans
Hondurans
4.6%
UNEMPLOYMENT
99.9/ 100
METRIC RATING
15th/ 347
METRIC RANK
5.7%
UNEMPLOYMENT
0.3/ 100
METRIC RATING
252nd/ 347
METRIC RANK
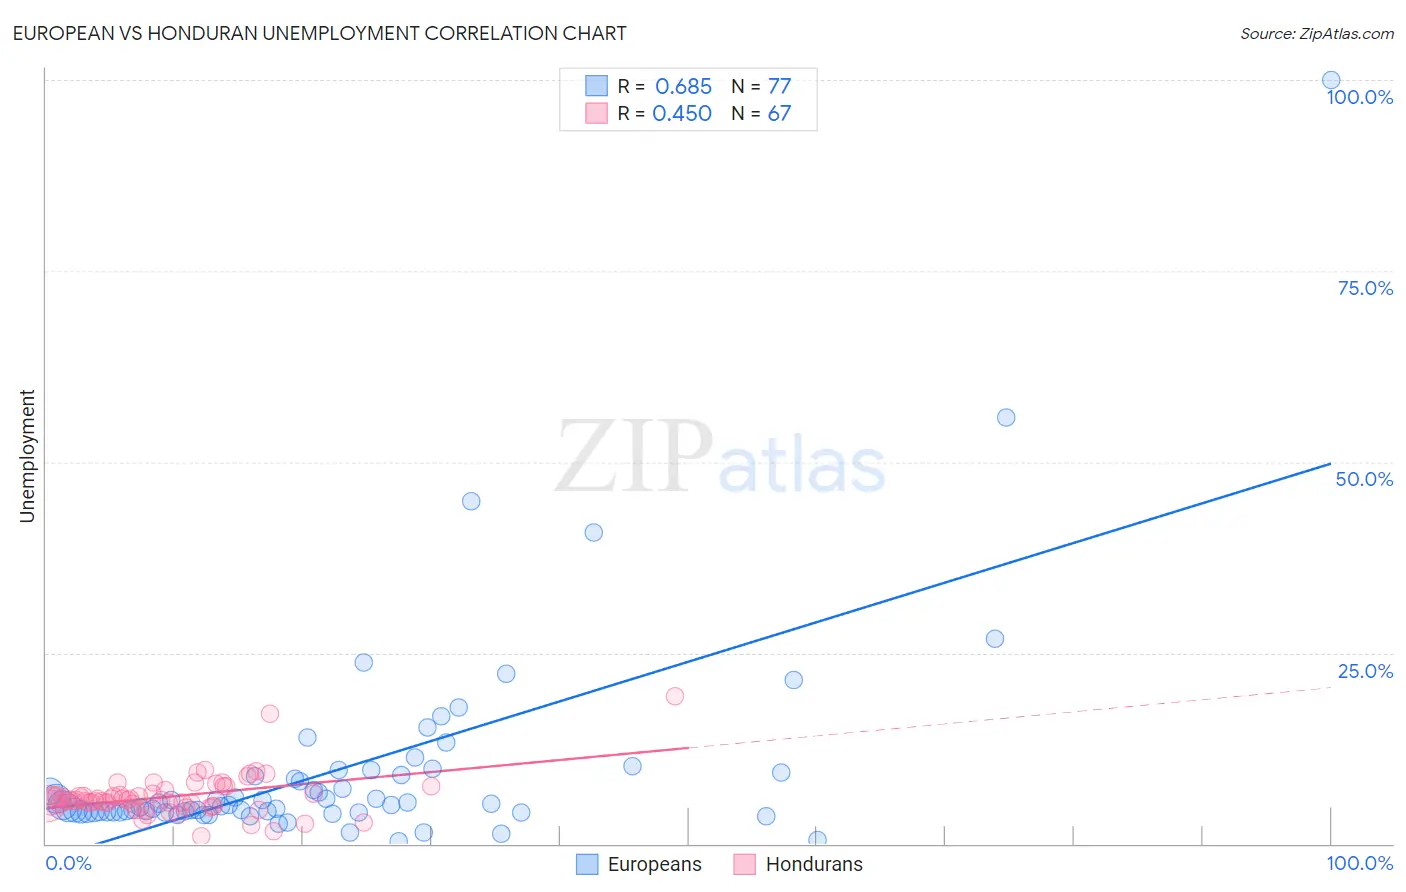
European vs Honduran Unemployment Correlation Chart
The statistical analysis conducted on geographies consisting of 558,532,246 people shows a significant positive correlation between the proportion of Europeans and unemployment in the United States with a correlation coefficient (R) of 0.685 and weighted average of 4.6%. Similarly, the statistical analysis conducted on geographies consisting of 357,563,016 people shows a moderate positive correlation between the proportion of Hondurans and unemployment in the United States with a correlation coefficient (R) of 0.450 and weighted average of 5.7%, a difference of 23.1%.
Unemployment Correlation Summary
| Measurement | European | Honduran |
| Minimum | 0.40% | 1.0% |
| Maximum | 100.0% | 19.3% |
| Range | 99.6% | 18.3% |
| Mean | 9.7% | 6.2% |
| Median | 5.0% | 5.7% |
| Interquartile 25% (IQ1) | 4.2% | 5.2% |
| Interquartile 75% (IQ3) | 9.2% | 7.1% |
| Interquartile Range (IQR) | 5.0% | 1.9% |
| Standard Deviation (Sample) | 14.1% | 2.8% |
| Standard Deviation (Population) | 14.0% | 2.8% |
Similar Demographics by Unemployment
Demographics Similar to Europeans by Unemployment
In terms of unemployment, the demographic groups most similar to Europeans are Chinese (4.7%, a difference of 0.14%), Slovene (4.7%, a difference of 0.24%), Immigrants from Venezuela (4.7%, a difference of 0.27%), Scottish (4.7%, a difference of 0.35%), and Immigrants from Cuba (4.6%, a difference of 0.48%).
| Demographics | Rating | Rank | Unemployment |
| Swiss | 100.0 /100 | #8 | Exceptional 4.5% |
| Scandinavians | 100.0 /100 | #9 | Exceptional 4.5% |
| Dutch | 100.0 /100 | #10 | Exceptional 4.6% |
| English | 100.0 /100 | #11 | Exceptional 4.6% |
| Pennsylvania Germans | 100.0 /100 | #12 | Exceptional 4.6% |
| Belgians | 100.0 /100 | #13 | Exceptional 4.6% |
| Immigrants | Cuba | 100.0 /100 | #14 | Exceptional 4.6% |
| Europeans | 99.9 /100 | #15 | Exceptional 4.6% |
| Chinese | 99.9 /100 | #16 | Exceptional 4.7% |
| Slovenes | 99.9 /100 | #17 | Exceptional 4.7% |
| Immigrants | Venezuela | 99.9 /100 | #18 | Exceptional 4.7% |
| Scottish | 99.9 /100 | #19 | Exceptional 4.7% |
| Carpatho Rusyns | 99.9 /100 | #20 | Exceptional 4.7% |
| Welsh | 99.9 /100 | #21 | Exceptional 4.7% |
| Thais | 99.9 /100 | #22 | Exceptional 4.7% |
Demographics Similar to Hondurans by Unemployment
In terms of unemployment, the demographic groups most similar to Hondurans are Central American (5.7%, a difference of 0.010%), Immigrants from Honduras (5.7%, a difference of 0.080%), Immigrants from Portugal (5.7%, a difference of 0.53%), Kiowa (5.7%, a difference of 0.74%), and Guatemalan (5.8%, a difference of 0.74%).
| Demographics | Rating | Rank | Unemployment |
| French American Indians | 1.2 /100 | #245 | Tragic 5.6% |
| Bermudans | 1.1 /100 | #246 | Tragic 5.6% |
| Immigrants | Cameroon | 1.0 /100 | #247 | Tragic 5.6% |
| Liberians | 0.9 /100 | #248 | Tragic 5.6% |
| Cajuns | 0.8 /100 | #249 | Tragic 5.6% |
| Japanese | 0.8 /100 | #250 | Tragic 5.6% |
| Kiowa | 0.6 /100 | #251 | Tragic 5.7% |
| Hondurans | 0.3 /100 | #252 | Tragic 5.7% |
| Central Americans | 0.3 /100 | #253 | Tragic 5.7% |
| Immigrants | Honduras | 0.3 /100 | #254 | Tragic 5.7% |
| Immigrants | Portugal | 0.2 /100 | #255 | Tragic 5.7% |
| Guatemalans | 0.2 /100 | #256 | Tragic 5.8% |
| Yaqui | 0.2 /100 | #257 | Tragic 5.8% |
| Immigrants | Bahamas | 0.1 /100 | #258 | Tragic 5.8% |
| Sub-Saharan Africans | 0.1 /100 | #259 | Tragic 5.8% |