Bulgarian vs Menominee Child Poverty Under the Age of 5
COMPARE
Bulgarian
Menominee
Child Poverty Under the Age of 5
Child Poverty Under the Age of 5 Comparison
Bulgarians
Menominee
13.9%
CHILD POVERTY UNDER THE AGE OF 5
99.9/ 100
METRIC RATING
23rd/ 347
METRIC RANK
23.3%
CHILD POVERTY UNDER THE AGE OF 5
0.0/ 100
METRIC RATING
317th/ 347
METRIC RANK
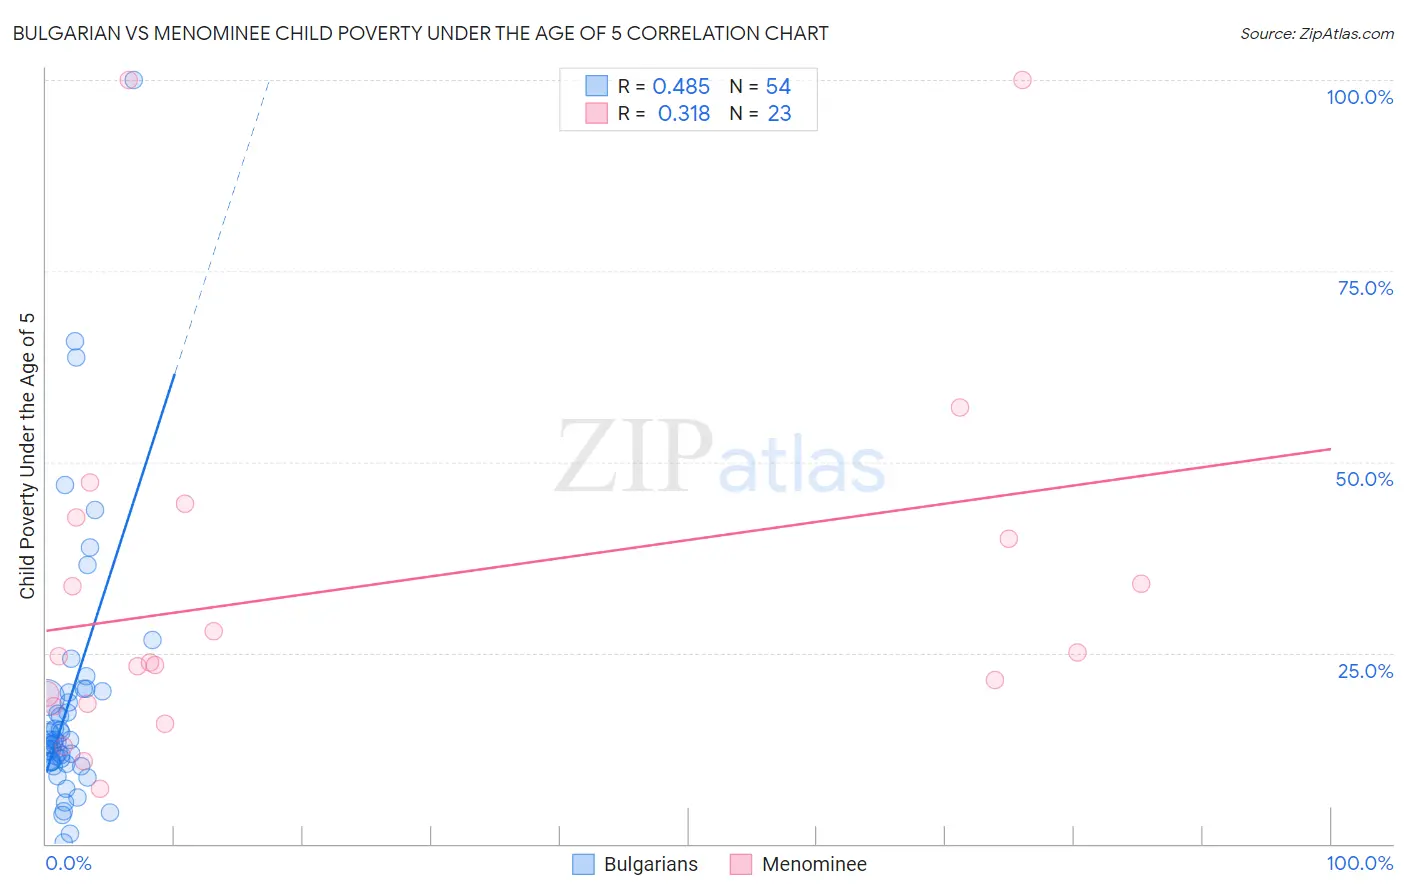
Bulgarian vs Menominee Child Poverty Under the Age of 5 Correlation Chart
The statistical analysis conducted on geographies consisting of 199,600,281 people shows a moderate positive correlation between the proportion of Bulgarians and poverty level among children under the age of 5 in the United States with a correlation coefficient (R) of 0.485 and weighted average of 13.9%. Similarly, the statistical analysis conducted on geographies consisting of 45,389,615 people shows a mild positive correlation between the proportion of Menominee and poverty level among children under the age of 5 in the United States with a correlation coefficient (R) of 0.318 and weighted average of 23.3%, a difference of 67.5%.
Child Poverty Under the Age of 5 Correlation Summary
| Measurement | Bulgarian | Menominee |
| Minimum | 0.17% | 7.1% |
| Maximum | 100.0% | 100.0% |
| Range | 99.8% | 92.9% |
| Mean | 18.5% | 33.5% |
| Median | 13.4% | 24.6% |
| Interquartile 25% (IQ1) | 10.7% | 18.4% |
| Interquartile 75% (IQ3) | 19.8% | 42.7% |
| Interquartile Range (IQR) | 9.1% | 24.3% |
| Standard Deviation (Sample) | 17.4% | 24.4% |
| Standard Deviation (Population) | 17.3% | 23.9% |
Similar Demographics by Child Poverty Under the Age of 5
Demographics Similar to Bulgarians by Child Poverty Under the Age of 5
In terms of child poverty under the age of 5, the demographic groups most similar to Bulgarians are Immigrants from Bolivia (13.8%, a difference of 0.44%), Asian (14.0%, a difference of 0.51%), Bolivian (13.8%, a difference of 0.52%), Cypriot (14.0%, a difference of 0.52%), and Immigrants from Japan (13.8%, a difference of 0.82%).
| Demographics | Rating | Rank | Child Poverty Under the Age of 5 |
| Immigrants | Eastern Asia | 100.0 /100 | #16 | Exceptional 13.5% |
| Assyrians/Chaldeans/Syriacs | 100.0 /100 | #17 | Exceptional 13.6% |
| Immigrants | China | 100.0 /100 | #18 | Exceptional 13.6% |
| Immigrants | Ireland | 100.0 /100 | #19 | Exceptional 13.7% |
| Immigrants | Japan | 100.0 /100 | #20 | Exceptional 13.8% |
| Bolivians | 100.0 /100 | #21 | Exceptional 13.8% |
| Immigrants | Bolivia | 100.0 /100 | #22 | Exceptional 13.8% |
| Bulgarians | 99.9 /100 | #23 | Exceptional 13.9% |
| Asians | 99.9 /100 | #24 | Exceptional 14.0% |
| Cypriots | 99.9 /100 | #25 | Exceptional 14.0% |
| Immigrants | Lithuania | 99.9 /100 | #26 | Exceptional 14.1% |
| Tongans | 99.9 /100 | #27 | Exceptional 14.2% |
| Immigrants | Indonesia | 99.8 /100 | #28 | Exceptional 14.3% |
| Immigrants | Asia | 99.8 /100 | #29 | Exceptional 14.4% |
| Cambodians | 99.8 /100 | #30 | Exceptional 14.4% |
Demographics Similar to Menominee by Child Poverty Under the Age of 5
In terms of child poverty under the age of 5, the demographic groups most similar to Menominee are Dutch West Indian (23.3%, a difference of 0.10%), Yakama (23.1%, a difference of 0.50%), Chippewa (23.4%, a difference of 0.58%), Arapaho (23.1%, a difference of 0.62%), and Choctaw (23.5%, a difference of 0.96%).
| Demographics | Rating | Rank | Child Poverty Under the Age of 5 |
| Africans | 0.0 /100 | #310 | Tragic 22.8% |
| Seminole | 0.0 /100 | #311 | Tragic 22.8% |
| Hondurans | 0.0 /100 | #312 | Tragic 23.0% |
| Bahamians | 0.0 /100 | #313 | Tragic 23.0% |
| U.S. Virgin Islanders | 0.0 /100 | #314 | Tragic 23.0% |
| Arapaho | 0.0 /100 | #315 | Tragic 23.1% |
| Yakama | 0.0 /100 | #316 | Tragic 23.1% |
| Menominee | 0.0 /100 | #317 | Tragic 23.3% |
| Dutch West Indians | 0.0 /100 | #318 | Tragic 23.3% |
| Chippewa | 0.0 /100 | #319 | Tragic 23.4% |
| Choctaw | 0.0 /100 | #320 | Tragic 23.5% |
| Immigrants | Honduras | 0.0 /100 | #321 | Tragic 23.5% |
| Ute | 0.0 /100 | #322 | Tragic 23.5% |
| Pueblo | 0.0 /100 | #323 | Tragic 23.7% |
| Paiute | 0.0 /100 | #324 | Tragic 23.8% |