Ethiopian vs English Disability Age 35 to 64
COMPARE
Ethiopian
English
Disability Age 35 to 64
Disability Age 35 to 64 Comparison
Ethiopians
English
10.5%
DISABILITY AGE 35 TO 64
97.4/ 100
METRIC RATING
108th/ 347
METRIC RANK
12.4%
DISABILITY AGE 35 TO 64
0.6/ 100
METRIC RATING
259th/ 347
METRIC RANK
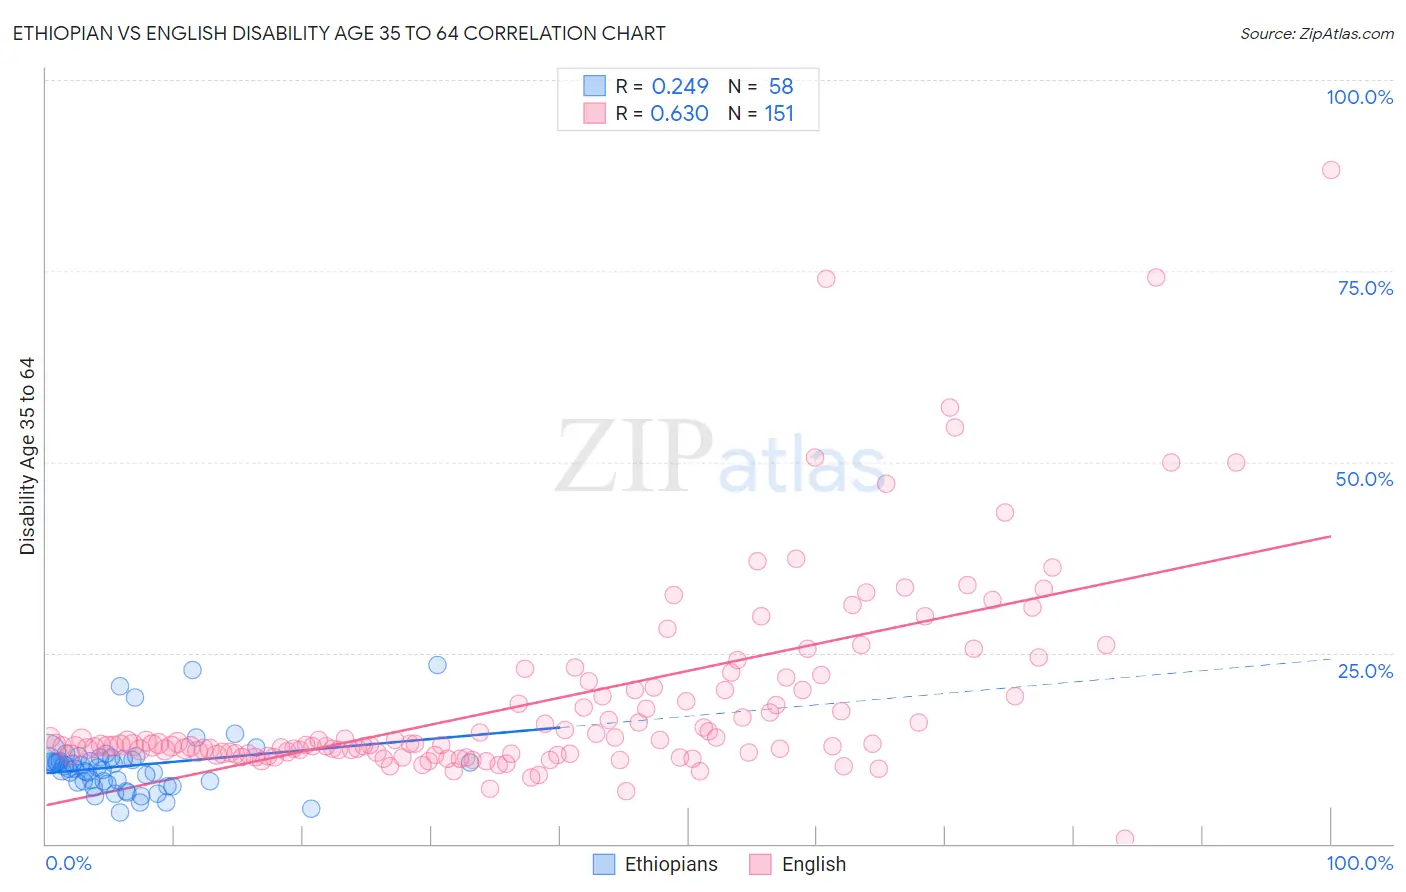
Ethiopian vs English Disability Age 35 to 64 Correlation Chart
The statistical analysis conducted on geographies consisting of 223,074,665 people shows a weak positive correlation between the proportion of Ethiopians and percentage of population with a disability between the ages 34 and 64 in the United States with a correlation coefficient (R) of 0.249 and weighted average of 10.5%. Similarly, the statistical analysis conducted on geographies consisting of 578,471,169 people shows a significant positive correlation between the proportion of English and percentage of population with a disability between the ages 34 and 64 in the United States with a correlation coefficient (R) of 0.630 and weighted average of 12.4%, a difference of 18.9%.
Disability Age 35 to 64 Correlation Summary
| Measurement | Ethiopian | English |
| Minimum | 4.1% | 0.65% |
| Maximum | 23.4% | 88.2% |
| Range | 19.4% | 87.6% |
| Mean | 10.2% | 18.7% |
| Median | 9.9% | 12.9% |
| Interquartile 25% (IQ1) | 8.0% | 11.8% |
| Interquartile 75% (IQ3) | 11.2% | 20.2% |
| Interquartile Range (IQR) | 3.2% | 8.4% |
| Standard Deviation (Sample) | 3.8% | 13.2% |
| Standard Deviation (Population) | 3.8% | 13.1% |
Similar Demographics by Disability Age 35 to 64
Demographics Similar to Ethiopians by Disability Age 35 to 64
In terms of disability age 35 to 64, the demographic groups most similar to Ethiopians are Zimbabwean (10.4%, a difference of 0.020%), Immigrants from Ethiopia (10.5%, a difference of 0.14%), Korean (10.5%, a difference of 0.20%), Immigrants from Hungary (10.4%, a difference of 0.21%), and Macedonian (10.4%, a difference of 0.36%).
| Demographics | Rating | Rank | Disability Age 35 to 64 |
| Immigrants | Philippines | 98.0 /100 | #101 | Exceptional 10.4% |
| Immigrants | Western Asia | 98.0 /100 | #102 | Exceptional 10.4% |
| Immigrants | Ukraine | 97.9 /100 | #103 | Exceptional 10.4% |
| Immigrants | Austria | 97.8 /100 | #104 | Exceptional 10.4% |
| Macedonians | 97.8 /100 | #105 | Exceptional 10.4% |
| Immigrants | Hungary | 97.6 /100 | #106 | Exceptional 10.4% |
| Zimbabweans | 97.4 /100 | #107 | Exceptional 10.4% |
| Ethiopians | 97.4 /100 | #108 | Exceptional 10.5% |
| Immigrants | Ethiopia | 97.2 /100 | #109 | Exceptional 10.5% |
| Koreans | 97.1 /100 | #110 | Exceptional 10.5% |
| Brazilians | 96.9 /100 | #111 | Exceptional 10.5% |
| Assyrians/Chaldeans/Syriacs | 96.8 /100 | #112 | Exceptional 10.5% |
| Tongans | 96.6 /100 | #113 | Exceptional 10.5% |
| Immigrants | Morocco | 96.6 /100 | #114 | Exceptional 10.5% |
| Immigrants | Netherlands | 96.3 /100 | #115 | Exceptional 10.5% |
Demographics Similar to English by Disability Age 35 to 64
In terms of disability age 35 to 64, the demographic groups most similar to English are Welsh (12.4%, a difference of 0.12%), Mexican (12.4%, a difference of 0.20%), German Russian (12.5%, a difference of 0.25%), Malaysian (12.5%, a difference of 0.40%), and Scottish (12.4%, a difference of 0.46%).
| Demographics | Rating | Rank | Disability Age 35 to 64 |
| Irish | 1.0 /100 | #252 | Tragic 12.3% |
| Dutch | 1.0 /100 | #253 | Tragic 12.3% |
| Hawaiians | 0.9 /100 | #254 | Tragic 12.3% |
| Japanese | 0.8 /100 | #255 | Tragic 12.3% |
| Scottish | 0.8 /100 | #256 | Tragic 12.4% |
| Mexicans | 0.7 /100 | #257 | Tragic 12.4% |
| Welsh | 0.6 /100 | #258 | Tragic 12.4% |
| English | 0.6 /100 | #259 | Tragic 12.4% |
| German Russians | 0.5 /100 | #260 | Tragic 12.5% |
| Malaysians | 0.5 /100 | #261 | Tragic 12.5% |
| Senegalese | 0.5 /100 | #262 | Tragic 12.5% |
| Immigrants | Zaire | 0.4 /100 | #263 | Tragic 12.5% |
| Immigrants | Portugal | 0.4 /100 | #264 | Tragic 12.5% |
| Marshallese | 0.4 /100 | #265 | Tragic 12.5% |
| Whites/Caucasians | 0.3 /100 | #266 | Tragic 12.6% |