Estonian vs Zimbabwean In Labor Force | Age 20-64
COMPARE
Estonian
Zimbabwean
In Labor Force | Age 20-64
In Labor Force | Age 20-64 Comparison
Estonians
Zimbabweans
80.0%
IN LABOR FORCE | AGE 20-64
94.0/ 100
METRIC RATING
110th/ 347
METRIC RANK
81.0%
IN LABOR FORCE | AGE 20-64
100.0/ 100
METRIC RATING
19th/ 347
METRIC RANK
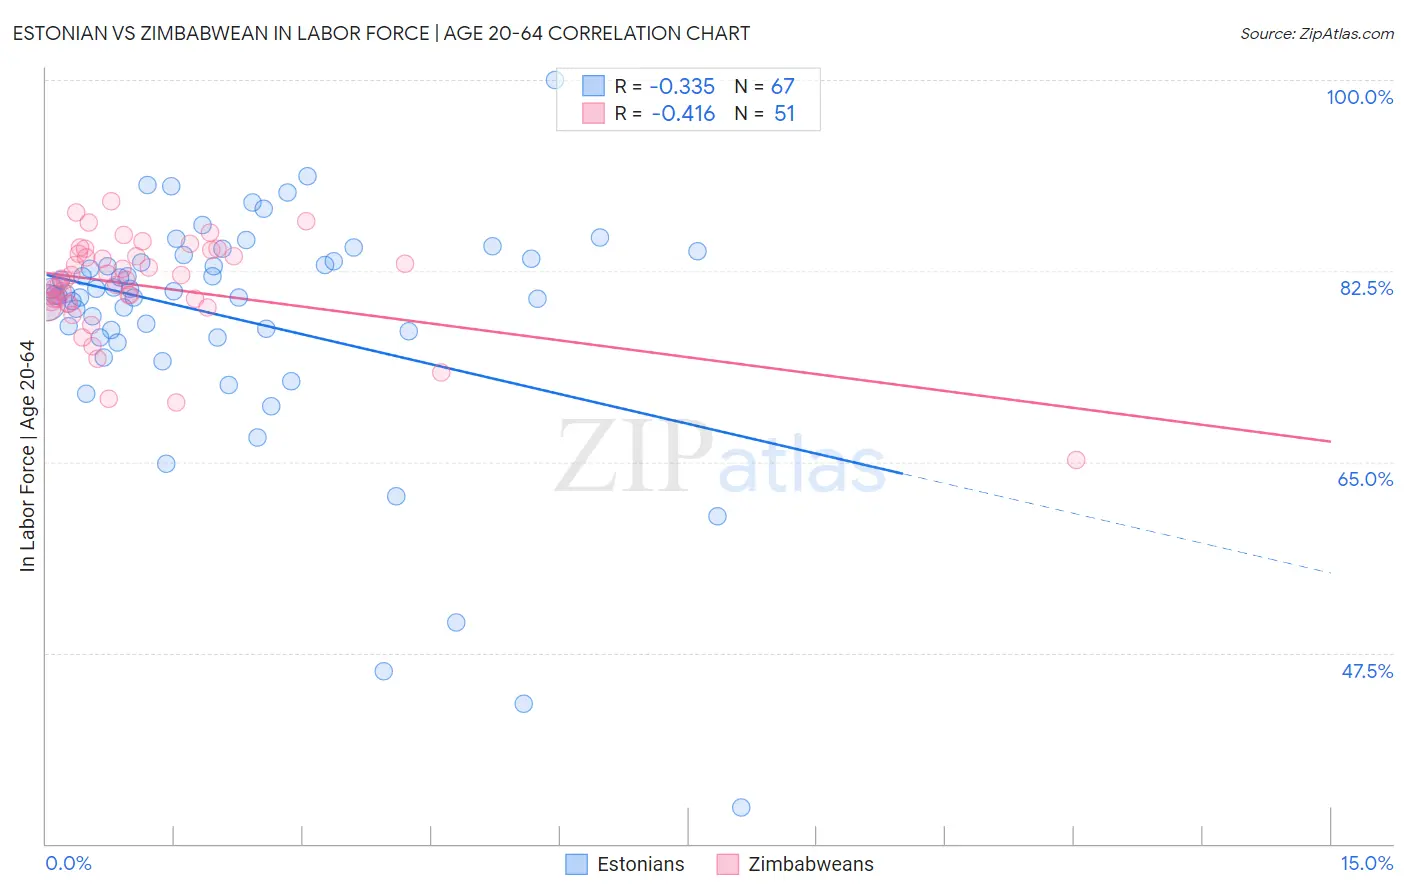
Estonian vs Zimbabwean In Labor Force | Age 20-64 Correlation Chart
The statistical analysis conducted on geographies consisting of 123,512,099 people shows a mild negative correlation between the proportion of Estonians and labor force participation rate among population between the ages 20 and 64 in the United States with a correlation coefficient (R) of -0.335 and weighted average of 80.0%. Similarly, the statistical analysis conducted on geographies consisting of 69,208,654 people shows a moderate negative correlation between the proportion of Zimbabweans and labor force participation rate among population between the ages 20 and 64 in the United States with a correlation coefficient (R) of -0.416 and weighted average of 81.0%, a difference of 1.2%.
In Labor Force | Age 20-64 Correlation Summary
| Measurement | Estonian | Zimbabwean |
| Minimum | 33.3% | 65.2% |
| Maximum | 100.0% | 88.9% |
| Range | 66.7% | 23.7% |
| Mean | 78.1% | 81.1% |
| Median | 80.4% | 81.7% |
| Interquartile 25% (IQ1) | 76.4% | 79.5% |
| Interquartile 75% (IQ3) | 83.6% | 84.0% |
| Interquartile Range (IQR) | 7.2% | 4.5% |
| Standard Deviation (Sample) | 11.2% | 4.5% |
| Standard Deviation (Population) | 11.1% | 4.5% |
Similar Demographics by In Labor Force | Age 20-64
Demographics Similar to Estonians by In Labor Force | Age 20-64
In terms of in labor force | age 20-64, the demographic groups most similar to Estonians are Immigrants from Argentina (80.0%, a difference of 0.0%), Immigrants from South America (80.0%, a difference of 0.0%), Immigrants from Italy (80.0%, a difference of 0.0%), Sri Lankan (80.0%, a difference of 0.0%), and Iranian (80.0%, a difference of 0.010%).
| Demographics | Rating | Rank | In Labor Force | Age 20-64 |
| Russians | 95.5 /100 | #103 | Exceptional 80.0% |
| Venezuelans | 95.3 /100 | #104 | Exceptional 80.0% |
| Immigrants | Ghana | 95.0 /100 | #105 | Exceptional 80.0% |
| Greeks | 94.8 /100 | #106 | Exceptional 80.0% |
| Immigrants | Jordan | 94.8 /100 | #107 | Exceptional 80.0% |
| Iranians | 94.3 /100 | #108 | Exceptional 80.0% |
| Immigrants | Argentina | 94.1 /100 | #109 | Exceptional 80.0% |
| Estonians | 94.0 /100 | #110 | Exceptional 80.0% |
| Immigrants | South America | 93.9 /100 | #111 | Exceptional 80.0% |
| Immigrants | Italy | 93.9 /100 | #112 | Exceptional 80.0% |
| Sri Lankans | 93.9 /100 | #113 | Exceptional 80.0% |
| Argentineans | 93.8 /100 | #114 | Exceptional 80.0% |
| Bermudans | 93.3 /100 | #115 | Exceptional 80.0% |
| Immigrants | Western Africa | 93.1 /100 | #116 | Exceptional 80.0% |
| Immigrants | Vietnam | 92.7 /100 | #117 | Exceptional 80.0% |
Demographics Similar to Zimbabweans by In Labor Force | Age 20-64
In terms of in labor force | age 20-64, the demographic groups most similar to Zimbabweans are Immigrants from Bulgaria (81.0%, a difference of 0.0%), Norwegian (81.0%, a difference of 0.020%), Thai (80.9%, a difference of 0.050%), Liberian (80.9%, a difference of 0.070%), and Bulgarian (81.1%, a difference of 0.12%).
| Demographics | Rating | Rank | In Labor Force | Age 20-64 |
| Immigrants | Eritrea | 100.0 /100 | #12 | Exceptional 81.3% |
| Immigrants | India | 100.0 /100 | #13 | Exceptional 81.3% |
| Cambodians | 100.0 /100 | #14 | Exceptional 81.1% |
| Bulgarians | 100.0 /100 | #15 | Exceptional 81.1% |
| Immigrants | Nepal | 100.0 /100 | #16 | Exceptional 81.1% |
| Norwegians | 100.0 /100 | #17 | Exceptional 81.0% |
| Immigrants | Bulgaria | 100.0 /100 | #18 | Exceptional 81.0% |
| Zimbabweans | 100.0 /100 | #19 | Exceptional 81.0% |
| Thais | 100.0 /100 | #20 | Exceptional 80.9% |
| Liberians | 100.0 /100 | #21 | Exceptional 80.9% |
| Sudanese | 100.0 /100 | #22 | Exceptional 80.8% |
| Immigrants | Bosnia and Herzegovina | 100.0 /100 | #23 | Exceptional 80.8% |
| Immigrants | Morocco | 100.0 /100 | #24 | Exceptional 80.8% |
| Kenyans | 100.0 /100 | #25 | Exceptional 80.8% |
| Immigrants | Serbia | 100.0 /100 | #26 | Exceptional 80.8% |