English vs Immigrants from Philippines Single Mother Poverty
COMPARE
English
Immigrants from Philippines
Single Mother Poverty
Single Mother Poverty Comparison
English
Immigrants from Philippines
30.2%
SINGLE MOTHER POVERTY
4.8/ 100
METRIC RATING
230th/ 347
METRIC RANK
26.5%
SINGLE MOTHER POVERTY
100.0/ 100
METRIC RATING
31st/ 347
METRIC RANK
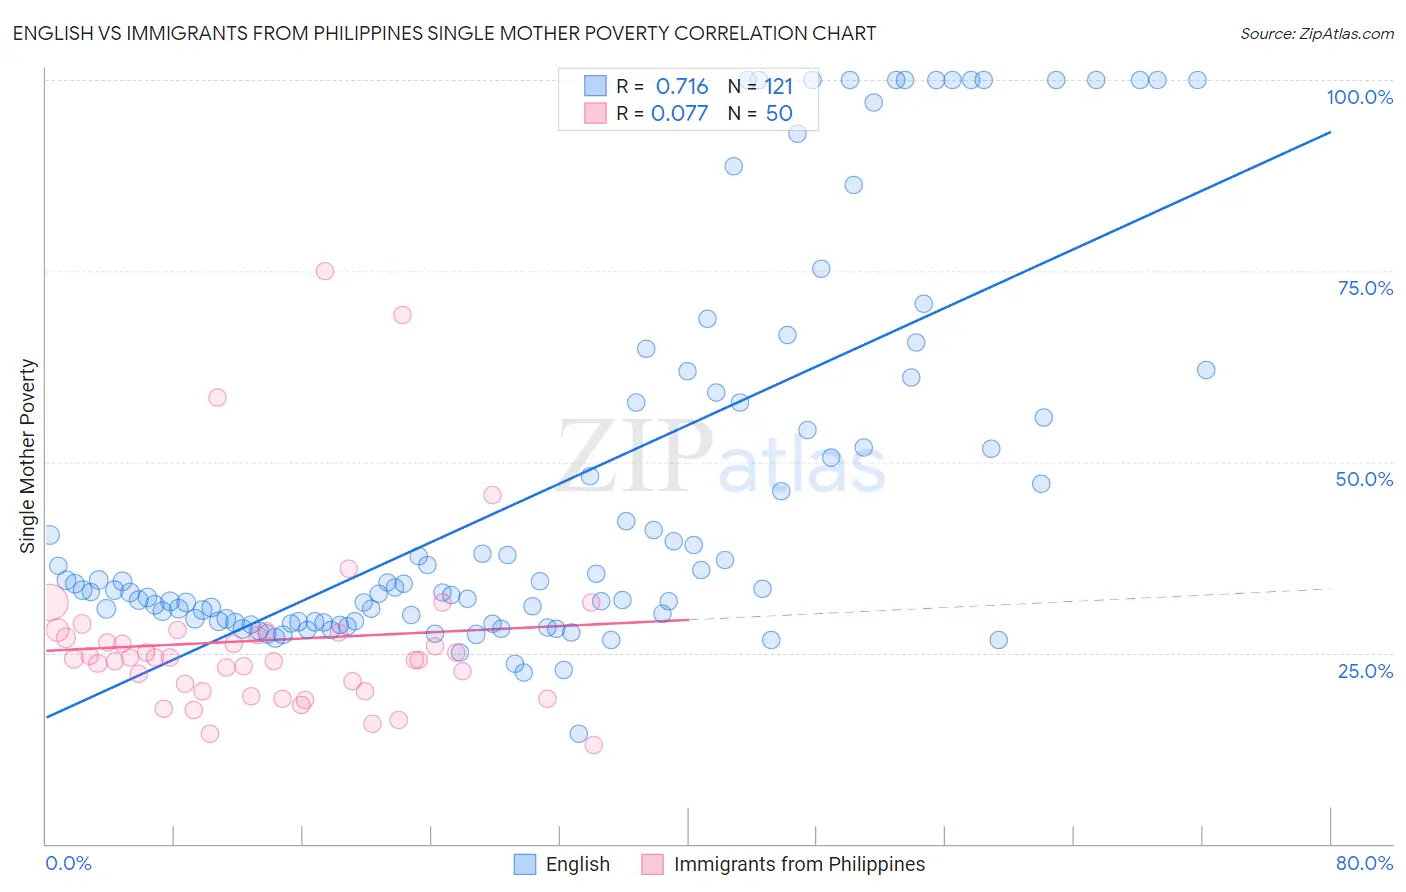
English vs Immigrants from Philippines Single Mother Poverty Correlation Chart
The statistical analysis conducted on geographies consisting of 548,772,059 people shows a strong positive correlation between the proportion of English and poverty level among single mothers in the United States with a correlation coefficient (R) of 0.716 and weighted average of 30.2%. Similarly, the statistical analysis conducted on geographies consisting of 457,544,992 people shows a slight positive correlation between the proportion of Immigrants from Philippines and poverty level among single mothers in the United States with a correlation coefficient (R) of 0.077 and weighted average of 26.5%, a difference of 14.1%.
Single Mother Poverty Correlation Summary
| Measurement | English | Immigrants from Philippines |
| Minimum | 14.4% | 12.9% |
| Maximum | 100.0% | 75.0% |
| Range | 85.6% | 62.1% |
| Mean | 46.2% | 26.6% |
| Median | 33.3% | 24.3% |
| Interquartile 25% (IQ1) | 29.1% | 20.0% |
| Interquartile 75% (IQ3) | 57.7% | 27.7% |
| Interquartile Range (IQR) | 28.6% | 7.7% |
| Standard Deviation (Sample) | 25.2% | 12.0% |
| Standard Deviation (Population) | 25.1% | 11.8% |
Similar Demographics by Single Mother Poverty
Demographics Similar to English by Single Mother Poverty
In terms of single mother poverty, the demographic groups most similar to English are Immigrants from Barbados (30.2%, a difference of 0.040%), Spaniard (30.2%, a difference of 0.13%), Dutch (30.2%, a difference of 0.15%), Alaskan Athabascan (30.3%, a difference of 0.19%), and Immigrants from Liberia (30.1%, a difference of 0.25%).
| Demographics | Rating | Rank | Single Mother Poverty |
| Immigrants | Cuba | 6.9 /100 | #223 | Tragic 30.1% |
| Immigrants | Sudan | 6.5 /100 | #224 | Tragic 30.1% |
| Spanish | 6.3 /100 | #225 | Tragic 30.1% |
| Scottish | 6.0 /100 | #226 | Tragic 30.1% |
| Immigrants | Liberia | 5.9 /100 | #227 | Tragic 30.1% |
| Spaniards | 5.4 /100 | #228 | Tragic 30.2% |
| Immigrants | Barbados | 5.0 /100 | #229 | Tragic 30.2% |
| English | 4.8 /100 | #230 | Tragic 30.2% |
| Dutch | 4.3 /100 | #231 | Tragic 30.2% |
| Alaskan Athabascans | 4.1 /100 | #232 | Tragic 30.3% |
| Immigrants | Middle Africa | 3.5 /100 | #233 | Tragic 30.3% |
| Immigrants | Nicaragua | 3.5 /100 | #234 | Tragic 30.3% |
| Immigrants | Grenada | 3.4 /100 | #235 | Tragic 30.3% |
| Welsh | 3.2 /100 | #236 | Tragic 30.4% |
| Immigrants | St. Vincent and the Grenadines | 3.1 /100 | #237 | Tragic 30.4% |
Demographics Similar to Immigrants from Philippines by Single Mother Poverty
In terms of single mother poverty, the demographic groups most similar to Immigrants from Philippines are Turkish (26.4%, a difference of 0.16%), Jordanian (26.4%, a difference of 0.24%), Tongan (26.5%, a difference of 0.25%), Bulgarian (26.5%, a difference of 0.28%), and Immigrants from Indonesia (26.6%, a difference of 0.29%).
| Demographics | Rating | Rank | Single Mother Poverty |
| Immigrants | Moldova | 100.0 /100 | #24 | Exceptional 26.2% |
| Immigrants | Asia | 100.0 /100 | #25 | Exceptional 26.3% |
| Immigrants | Sri Lanka | 100.0 /100 | #26 | Exceptional 26.3% |
| Immigrants | Japan | 100.0 /100 | #27 | Exceptional 26.4% |
| Koreans | 100.0 /100 | #28 | Exceptional 26.4% |
| Jordanians | 100.0 /100 | #29 | Exceptional 26.4% |
| Turks | 100.0 /100 | #30 | Exceptional 26.4% |
| Immigrants | Philippines | 100.0 /100 | #31 | Exceptional 26.5% |
| Tongans | 99.9 /100 | #32 | Exceptional 26.5% |
| Bulgarians | 99.9 /100 | #33 | Exceptional 26.5% |
| Immigrants | Indonesia | 99.9 /100 | #34 | Exceptional 26.6% |
| Maltese | 99.9 /100 | #35 | Exceptional 26.6% |
| Okinawans | 99.9 /100 | #36 | Exceptional 26.6% |
| Immigrants | Israel | 99.9 /100 | #37 | Exceptional 26.6% |
| Immigrants | Fiji | 99.9 /100 | #38 | Exceptional 26.6% |