Eastern European vs Blackfeet Unemployment Among Youth under 25 years
COMPARE
Eastern European
Blackfeet
Unemployment Among Youth under 25 years
Unemployment Among Youth under 25 years Comparison
Eastern Europeans
Blackfeet
11.6%
UNEMPLOYMENT AMONG YOUTH UNDER 25 YEARS
57.5/ 100
METRIC RATING
169th/ 347
METRIC RANK
13.3%
UNEMPLOYMENT AMONG YOUTH UNDER 25 YEARS
0.0/ 100
METRIC RATING
286th/ 347
METRIC RANK
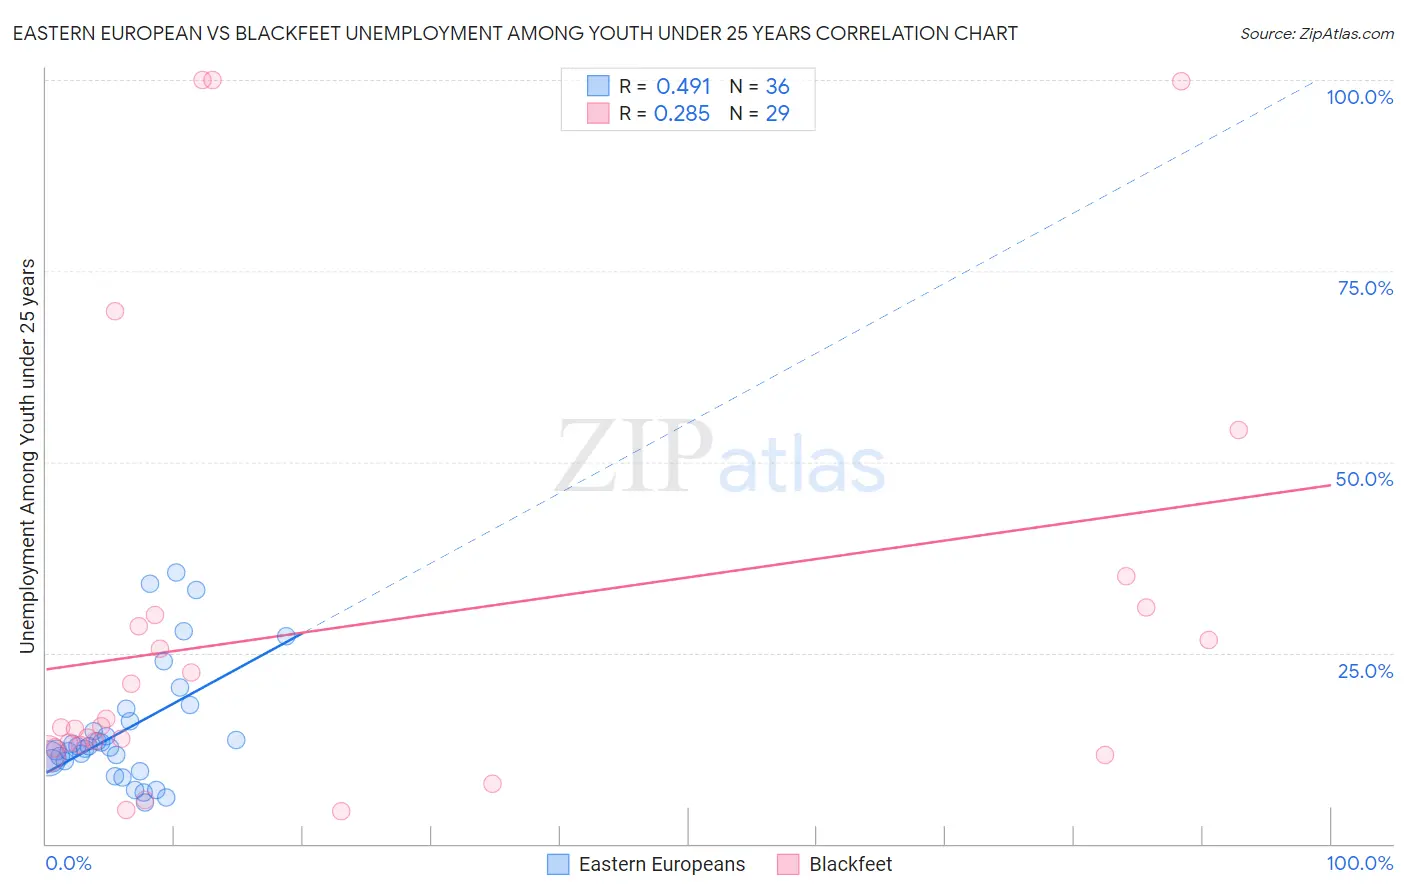
Eastern European vs Blackfeet Unemployment Among Youth under 25 years Correlation Chart
The statistical analysis conducted on geographies consisting of 451,295,495 people shows a moderate positive correlation between the proportion of Eastern Europeans and unemployment rate among youth under the age of 25 in the United States with a correlation coefficient (R) of 0.491 and weighted average of 11.6%. Similarly, the statistical analysis conducted on geographies consisting of 306,373,464 people shows a weak positive correlation between the proportion of Blackfeet and unemployment rate among youth under the age of 25 in the United States with a correlation coefficient (R) of 0.285 and weighted average of 13.3%, a difference of 15.0%.
Unemployment Among Youth under 25 years Correlation Summary
| Measurement | Eastern European | Blackfeet |
| Minimum | 5.3% | 4.2% |
| Maximum | 35.5% | 100.0% |
| Range | 30.2% | 95.8% |
| Mean | 15.0% | 28.6% |
| Median | 12.7% | 15.4% |
| Interquartile 25% (IQ1) | 10.9% | 12.8% |
| Interquartile 75% (IQ3) | 16.9% | 30.4% |
| Interquartile Range (IQR) | 6.0% | 17.7% |
| Standard Deviation (Sample) | 7.9% | 28.4% |
| Standard Deviation (Population) | 7.8% | 27.9% |
Similar Demographics by Unemployment Among Youth under 25 years
Demographics Similar to Eastern Europeans by Unemployment Among Youth under 25 years
In terms of unemployment among youth under 25 years, the demographic groups most similar to Eastern Europeans are Potawatomi (11.6%, a difference of 0.010%), Russian (11.6%, a difference of 0.010%), Okinawan (11.6%, a difference of 0.050%), Bangladeshi (11.6%, a difference of 0.080%), and Immigrants from Morocco (11.6%, a difference of 0.10%).
| Demographics | Rating | Rank | Unemployment Among Youth under 25 years |
| Immigrants | Northern Africa | 62.7 /100 | #162 | Good 11.5% |
| Immigrants | Kazakhstan | 62.7 /100 | #163 | Good 11.5% |
| Immigrants | Laos | 62.4 /100 | #164 | Good 11.5% |
| Immigrants | Sweden | 61.3 /100 | #165 | Good 11.5% |
| Spanish | 60.3 /100 | #166 | Good 11.6% |
| Okinawans | 58.7 /100 | #167 | Average 11.6% |
| Potawatomi | 57.9 /100 | #168 | Average 11.6% |
| Eastern Europeans | 57.5 /100 | #169 | Average 11.6% |
| Russians | 57.3 /100 | #170 | Average 11.6% |
| Bangladeshis | 55.6 /100 | #171 | Average 11.6% |
| Immigrants | Morocco | 55.1 /100 | #172 | Average 11.6% |
| Immigrants | South Eastern Asia | 51.7 /100 | #173 | Average 11.6% |
| Immigrants | China | 50.0 /100 | #174 | Average 11.6% |
| Immigrants | Iraq | 47.0 /100 | #175 | Average 11.6% |
| Ugandans | 45.6 /100 | #176 | Average 11.6% |
Demographics Similar to Blackfeet by Unemployment Among Youth under 25 years
In terms of unemployment among youth under 25 years, the demographic groups most similar to Blackfeet are Ecuadorian (13.3%, a difference of 0.010%), Ghanaian (13.3%, a difference of 0.050%), Lumbee (13.3%, a difference of 0.14%), Immigrants from Cameroon (13.3%, a difference of 0.15%), and Sierra Leonean (13.3%, a difference of 0.17%).
| Demographics | Rating | Rank | Unemployment Among Youth under 25 years |
| Cajuns | 0.0 /100 | #279 | Tragic 13.2% |
| Ute | 0.0 /100 | #280 | Tragic 13.3% |
| Armenians | 0.0 /100 | #281 | Tragic 13.3% |
| Sierra Leoneans | 0.0 /100 | #282 | Tragic 13.3% |
| Immigrants | Cameroon | 0.0 /100 | #283 | Tragic 13.3% |
| Lumbee | 0.0 /100 | #284 | Tragic 13.3% |
| Ghanaians | 0.0 /100 | #285 | Tragic 13.3% |
| Blackfeet | 0.0 /100 | #286 | Tragic 13.3% |
| Ecuadorians | 0.0 /100 | #287 | Tragic 13.3% |
| Immigrants | Western Africa | 0.0 /100 | #288 | Tragic 13.4% |
| Immigrants | Ghana | 0.0 /100 | #289 | Tragic 13.4% |
| Immigrants | Ecuador | 0.0 /100 | #290 | Tragic 13.4% |
| Apache | 0.0 /100 | #291 | Tragic 13.5% |
| Central American Indians | 0.0 /100 | #292 | Tragic 13.5% |
| Spanish American Indians | 0.0 /100 | #293 | Tragic 13.5% |