Dutch West Indian vs Immigrants from France Poverty
COMPARE
Dutch West Indian
Immigrants from France
Poverty
Poverty Comparison
Dutch West Indians
Immigrants from France
15.6%
POVERTY
0.0/ 100
METRIC RATING
310th/ 347
METRIC RANK
11.9%
POVERTY
80.5/ 100
METRIC RATING
141st/ 347
METRIC RANK
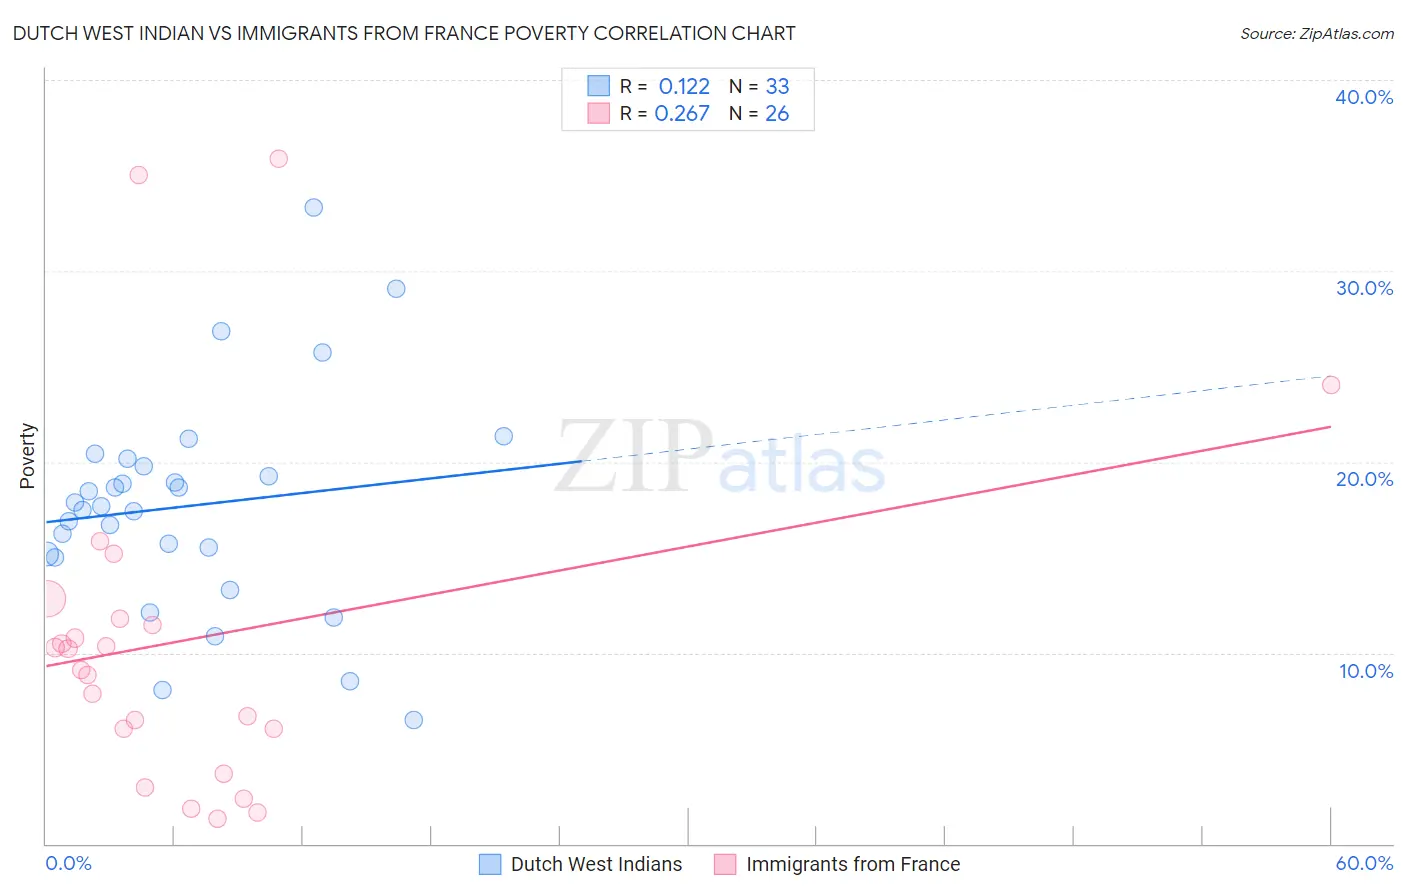
Dutch West Indian vs Immigrants from France Poverty Correlation Chart
The statistical analysis conducted on geographies consisting of 85,763,353 people shows a poor positive correlation between the proportion of Dutch West Indians and poverty level in the United States with a correlation coefficient (R) of 0.122 and weighted average of 15.6%. Similarly, the statistical analysis conducted on geographies consisting of 287,842,185 people shows a weak positive correlation between the proportion of Immigrants from France and poverty level in the United States with a correlation coefficient (R) of 0.267 and weighted average of 11.9%, a difference of 31.4%.
Poverty Correlation Summary
| Measurement | Dutch West Indian | Immigrants from France |
| Minimum | 6.5% | 1.3% |
| Maximum | 33.3% | 35.9% |
| Range | 26.8% | 34.6% |
| Mean | 17.7% | 10.7% |
| Median | 17.7% | 9.7% |
| Interquartile 25% (IQ1) | 15.1% | 6.0% |
| Interquartile 75% (IQ3) | 20.0% | 11.8% |
| Interquartile Range (IQR) | 4.9% | 5.8% |
| Standard Deviation (Sample) | 5.7% | 8.9% |
| Standard Deviation (Population) | 5.6% | 8.7% |
Similar Demographics by Poverty
Demographics Similar to Dutch West Indians by Poverty
In terms of poverty, the demographic groups most similar to Dutch West Indians are Seminole (15.6%, a difference of 0.090%), Choctaw (15.6%, a difference of 0.13%), African (15.6%, a difference of 0.24%), Creek (15.6%, a difference of 0.32%), and Chippewa (15.7%, a difference of 0.39%).
| Demographics | Rating | Rank | Poverty |
| Immigrants | Caribbean | 0.0 /100 | #303 | Tragic 15.5% |
| Immigrants | Mexico | 0.0 /100 | #304 | Tragic 15.5% |
| Immigrants | Guatemala | 0.0 /100 | #305 | Tragic 15.5% |
| Creek | 0.0 /100 | #306 | Tragic 15.6% |
| Africans | 0.0 /100 | #307 | Tragic 15.6% |
| Choctaw | 0.0 /100 | #308 | Tragic 15.6% |
| Seminole | 0.0 /100 | #309 | Tragic 15.6% |
| Dutch West Indians | 0.0 /100 | #310 | Tragic 15.6% |
| Chippewa | 0.0 /100 | #311 | Tragic 15.7% |
| Cajuns | 0.0 /100 | #312 | Tragic 15.7% |
| Immigrants | Grenada | 0.0 /100 | #313 | Tragic 15.8% |
| Immigrants | Somalia | 0.0 /100 | #314 | Tragic 15.8% |
| British West Indians | 0.0 /100 | #315 | Tragic 15.9% |
| Hondurans | 0.0 /100 | #316 | Tragic 15.9% |
| U.S. Virgin Islanders | 0.0 /100 | #317 | Tragic 16.1% |
Demographics Similar to Immigrants from France by Poverty
In terms of poverty, the demographic groups most similar to Immigrants from France are Basque (11.9%, a difference of 0.020%), Immigrants from Peru (11.9%, a difference of 0.090%), Brazilian (11.9%, a difference of 0.12%), Pakistani (11.9%, a difference of 0.28%), and Immigrants from Jordan (11.9%, a difference of 0.31%).
| Demographics | Rating | Rank | Poverty |
| Yugoslavians | 85.2 /100 | #134 | Excellent 11.8% |
| Immigrants | Vietnam | 85.2 /100 | #135 | Excellent 11.8% |
| Chileans | 84.2 /100 | #136 | Excellent 11.8% |
| Immigrants | Switzerland | 83.0 /100 | #137 | Excellent 11.8% |
| Immigrants | Jordan | 82.4 /100 | #138 | Excellent 11.9% |
| Pakistanis | 82.2 /100 | #139 | Excellent 11.9% |
| Immigrants | Peru | 81.1 /100 | #140 | Excellent 11.9% |
| Immigrants | France | 80.5 /100 | #141 | Excellent 11.9% |
| Basques | 80.4 /100 | #142 | Excellent 11.9% |
| Brazilians | 79.7 /100 | #143 | Good 11.9% |
| Icelanders | 77.9 /100 | #144 | Good 11.9% |
| Syrians | 75.1 /100 | #145 | Good 12.0% |
| Afghans | 74.9 /100 | #146 | Good 12.0% |
| Immigrants | Bosnia and Herzegovina | 73.7 /100 | #147 | Good 12.0% |
| Immigrants | Germany | 72.7 /100 | #148 | Good 12.0% |