Dutch vs South African Male Poverty
COMPARE
Dutch
South African
Male Poverty
Male Poverty Comparison
Dutch
South Africans
10.2%
MALE POVERTY
96.9/ 100
METRIC RATING
76th/ 347
METRIC RANK
10.7%
MALE POVERTY
86.8/ 100
METRIC RATING
123rd/ 347
METRIC RANK
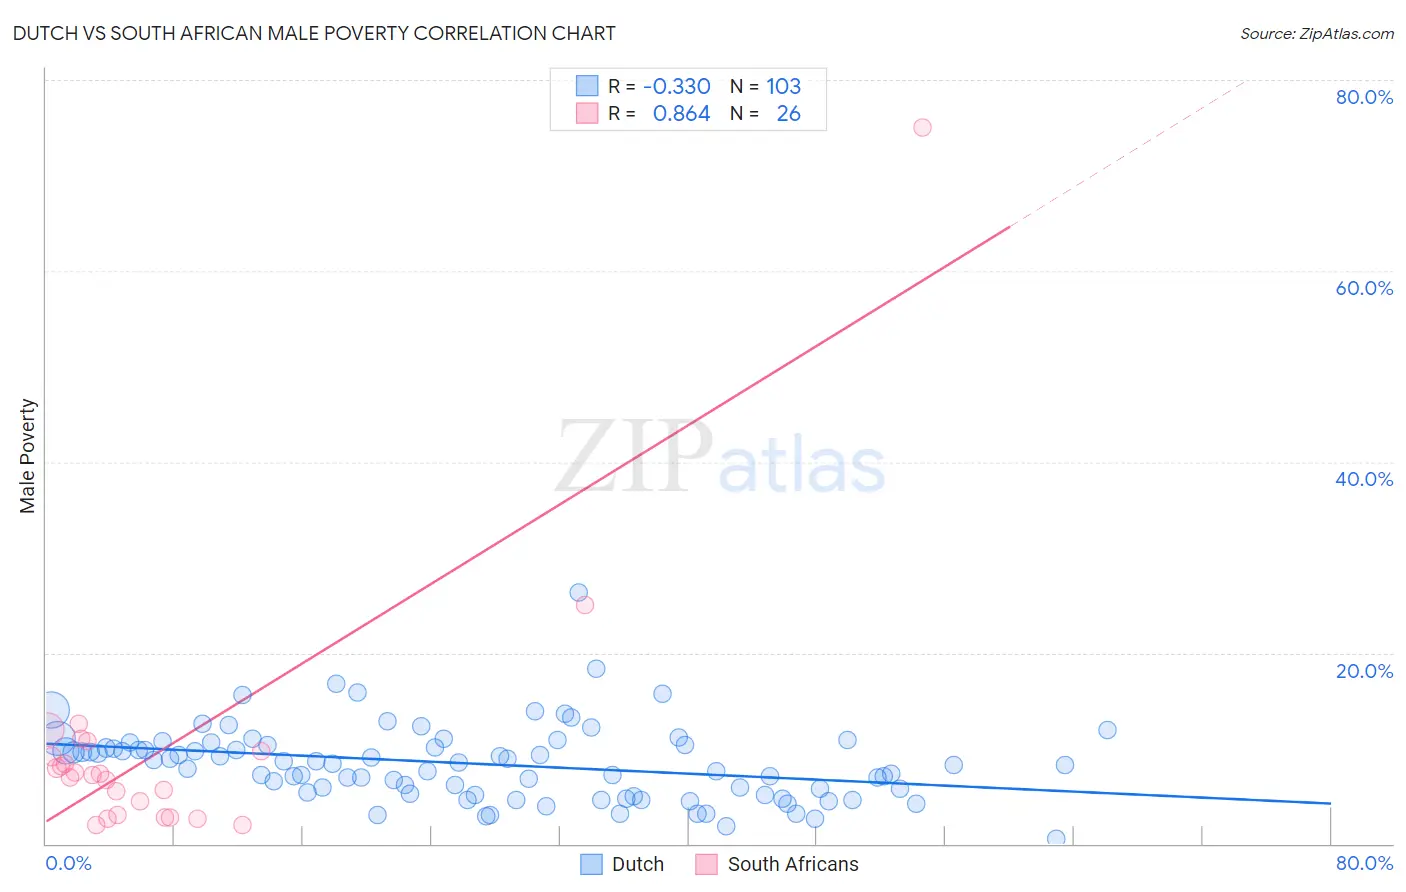
Dutch vs South African Male Poverty Correlation Chart
The statistical analysis conducted on geographies consisting of 553,017,798 people shows a mild negative correlation between the proportion of Dutch and poverty level among males in the United States with a correlation coefficient (R) of -0.330 and weighted average of 10.2%. Similarly, the statistical analysis conducted on geographies consisting of 182,517,352 people shows a very strong positive correlation between the proportion of South Africans and poverty level among males in the United States with a correlation coefficient (R) of 0.864 and weighted average of 10.7%, a difference of 4.1%.
Male Poverty Correlation Summary
| Measurement | Dutch | South African |
| Minimum | 0.58% | 2.0% |
| Maximum | 26.3% | 75.0% |
| Range | 25.7% | 73.0% |
| Mean | 8.4% | 9.9% |
| Median | 8.4% | 7.2% |
| Interquartile 25% (IQ1) | 5.3% | 3.0% |
| Interquartile 75% (IQ3) | 10.4% | 9.7% |
| Interquartile Range (IQR) | 5.1% | 6.6% |
| Standard Deviation (Sample) | 3.9% | 14.1% |
| Standard Deviation (Population) | 3.9% | 13.8% |
Similar Demographics by Male Poverty
Demographics Similar to Dutch by Male Poverty
In terms of male poverty, the demographic groups most similar to Dutch are Immigrants from Eastern Europe (10.2%, a difference of 0.010%), Carpatho Rusyn (10.2%, a difference of 0.010%), Immigrants from Belgium (10.3%, a difference of 0.030%), Irish (10.3%, a difference of 0.050%), and Immigrants from Asia (10.2%, a difference of 0.080%).
| Demographics | Rating | Rank | Male Poverty |
| Immigrants | Australia | 97.1 /100 | #69 | Exceptional 10.2% |
| Paraguayans | 97.1 /100 | #70 | Exceptional 10.2% |
| Europeans | 97.1 /100 | #71 | Exceptional 10.2% |
| Immigrants | Canada | 97.1 /100 | #72 | Exceptional 10.2% |
| Immigrants | Asia | 97.0 /100 | #73 | Exceptional 10.2% |
| Immigrants | Eastern Europe | 96.9 /100 | #74 | Exceptional 10.2% |
| Carpatho Rusyns | 96.9 /100 | #75 | Exceptional 10.2% |
| Dutch | 96.9 /100 | #76 | Exceptional 10.2% |
| Immigrants | Belgium | 96.8 /100 | #77 | Exceptional 10.3% |
| Irish | 96.8 /100 | #78 | Exceptional 10.3% |
| Immigrants | North America | 96.5 /100 | #79 | Exceptional 10.3% |
| English | 96.4 /100 | #80 | Exceptional 10.3% |
| Belgians | 95.9 /100 | #81 | Exceptional 10.3% |
| Egyptians | 95.9 /100 | #82 | Exceptional 10.3% |
| Immigrants | Sweden | 95.7 /100 | #83 | Exceptional 10.3% |
Demographics Similar to South Africans by Male Poverty
In terms of male poverty, the demographic groups most similar to South Africans are French (10.7%, a difference of 0.030%), Native Hawaiian (10.7%, a difference of 0.040%), Peruvian (10.7%, a difference of 0.060%), Immigrants from China (10.7%, a difference of 0.070%), and Immigrants from Hungary (10.7%, a difference of 0.17%).
| Demographics | Rating | Rank | Male Poverty |
| Sri Lankans | 88.1 /100 | #116 | Excellent 10.6% |
| Immigrants | South Eastern Asia | 88.1 /100 | #117 | Excellent 10.6% |
| Okinawans | 87.6 /100 | #118 | Excellent 10.7% |
| Immigrants | Hungary | 87.6 /100 | #119 | Excellent 10.7% |
| Immigrants | China | 87.1 /100 | #120 | Excellent 10.7% |
| Peruvians | 87.1 /100 | #121 | Excellent 10.7% |
| Native Hawaiians | 87.0 /100 | #122 | Excellent 10.7% |
| South Africans | 86.8 /100 | #123 | Excellent 10.7% |
| French | 86.7 /100 | #124 | Excellent 10.7% |
| Immigrants | Norway | 86.0 /100 | #125 | Excellent 10.7% |
| Immigrants | Ukraine | 84.3 /100 | #126 | Excellent 10.7% |
| Puget Sound Salish | 84.3 /100 | #127 | Excellent 10.7% |
| Immigrants | Western Europe | 84.2 /100 | #128 | Excellent 10.7% |
| Immigrants | Peru | 84.1 /100 | #129 | Excellent 10.7% |
| Chileans | 83.9 /100 | #130 | Excellent 10.7% |