Dutch vs Navajo Professional Degree
COMPARE
Dutch
Navajo
Professional Degree
Professional Degree Comparison
Dutch
Navajo
4.0%
PROFESSIONAL DEGREE
9.0/ 100
METRIC RATING
218th/ 347
METRIC RANK
2.9%
PROFESSIONAL DEGREE
0.0/ 100
METRIC RATING
338th/ 347
METRIC RANK
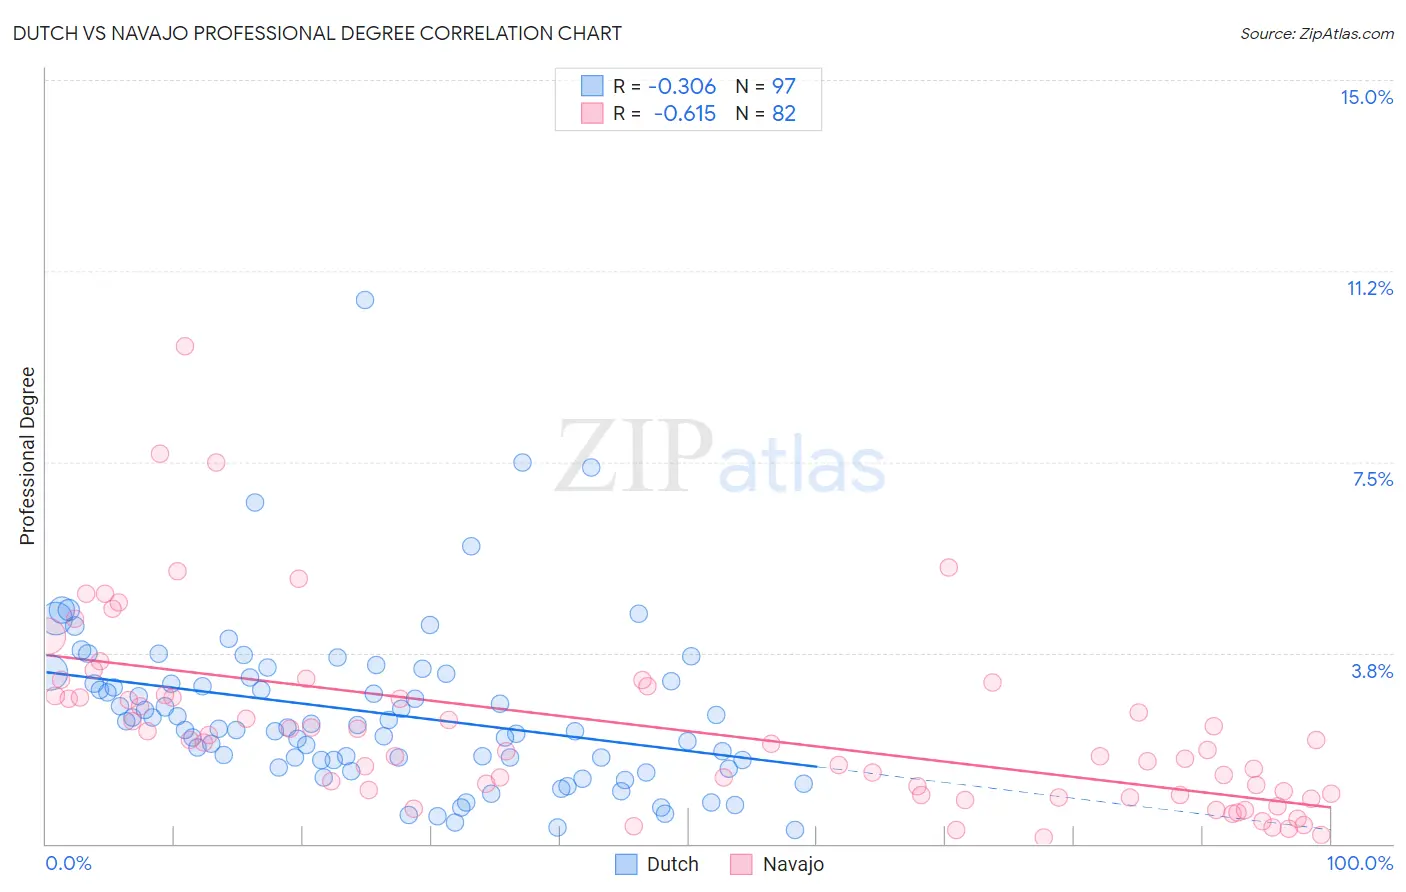
Dutch vs Navajo Professional Degree Correlation Chart
The statistical analysis conducted on geographies consisting of 547,430,412 people shows a mild negative correlation between the proportion of Dutch and percentage of population with at least professional degree education in the United States with a correlation coefficient (R) of -0.306 and weighted average of 4.0%. Similarly, the statistical analysis conducted on geographies consisting of 224,034,361 people shows a significant negative correlation between the proportion of Navajo and percentage of population with at least professional degree education in the United States with a correlation coefficient (R) of -0.615 and weighted average of 2.9%, a difference of 40.5%.
Professional Degree Correlation Summary
| Measurement | Dutch | Navajo |
| Minimum | 0.26% | 0.11% |
| Maximum | 10.7% | 9.8% |
| Range | 10.4% | 9.7% |
| Mean | 2.6% | 2.3% |
| Median | 2.3% | 1.9% |
| Interquartile 25% (IQ1) | 1.6% | 0.96% |
| Interquartile 75% (IQ3) | 3.2% | 2.9% |
| Interquartile Range (IQR) | 1.6% | 1.9% |
| Standard Deviation (Sample) | 1.6% | 1.8% |
| Standard Deviation (Population) | 1.6% | 1.8% |
Similar Demographics by Professional Degree
Demographics Similar to Dutch by Professional Degree
In terms of professional degree, the demographic groups most similar to Dutch are Immigrants from South Eastern Asia (4.0%, a difference of 0.030%), Immigrants from Vietnam (4.0%, a difference of 0.21%), West Indian (4.1%, a difference of 0.37%), Ute (4.0%, a difference of 0.39%), and French Canadian (4.0%, a difference of 0.52%).
| Demographics | Rating | Rank | Professional Degree |
| Germans | 11.6 /100 | #211 | Poor 4.1% |
| Whites/Caucasians | 11.2 /100 | #212 | Poor 4.1% |
| Koreans | 10.7 /100 | #213 | Poor 4.1% |
| Immigrants | Ghana | 10.6 /100 | #214 | Poor 4.1% |
| Portuguese | 10.5 /100 | #215 | Poor 4.1% |
| West Indians | 9.8 /100 | #216 | Tragic 4.1% |
| Immigrants | Vietnam | 9.4 /100 | #217 | Tragic 4.0% |
| Dutch | 9.0 /100 | #218 | Tragic 4.0% |
| Immigrants | South Eastern Asia | 8.9 /100 | #219 | Tragic 4.0% |
| Ute | 8.2 /100 | #220 | Tragic 4.0% |
| French Canadians | 8.0 /100 | #221 | Tragic 4.0% |
| Immigrants | Western Africa | 7.5 /100 | #222 | Tragic 4.0% |
| Immigrants | Bosnia and Herzegovina | 7.4 /100 | #223 | Tragic 4.0% |
| Trinidadians and Tobagonians | 7.1 /100 | #224 | Tragic 4.0% |
| Tlingit-Haida | 6.9 /100 | #225 | Tragic 4.0% |
Demographics Similar to Navajo by Professional Degree
In terms of professional degree, the demographic groups most similar to Navajo are Arapaho (2.9%, a difference of 0.070%), Immigrants from Central America (2.9%, a difference of 0.12%), Yup'ik (2.9%, a difference of 0.17%), Tohono O'odham (2.8%, a difference of 0.95%), and Immigrants from the Azores (2.8%, a difference of 1.6%).
| Demographics | Rating | Rank | Professional Degree |
| Kiowa | 0.0 /100 | #331 | Tragic 3.1% |
| Yakama | 0.0 /100 | #332 | Tragic 3.1% |
| Puget Sound Salish | 0.0 /100 | #333 | Tragic 3.1% |
| Pennsylvania Germans | 0.0 /100 | #334 | Tragic 3.0% |
| Natives/Alaskans | 0.0 /100 | #335 | Tragic 3.0% |
| Fijians | 0.0 /100 | #336 | Tragic 2.9% |
| Arapaho | 0.0 /100 | #337 | Tragic 2.9% |
| Navajo | 0.0 /100 | #338 | Tragic 2.9% |
| Immigrants | Central America | 0.0 /100 | #339 | Tragic 2.9% |
| Yup'ik | 0.0 /100 | #340 | Tragic 2.9% |
| Tohono O'odham | 0.0 /100 | #341 | Tragic 2.8% |
| Immigrants | Azores | 0.0 /100 | #342 | Tragic 2.8% |
| Mexicans | 0.0 /100 | #343 | Tragic 2.7% |
| Spanish American Indians | 0.0 /100 | #344 | Tragic 2.7% |
| Immigrants | Mexico | 0.0 /100 | #345 | Tragic 2.6% |