Indonesian vs Immigrants from Cuba Single Mother Poverty
COMPARE
Indonesian
Immigrants from Cuba
Single Mother Poverty
Single Mother Poverty Comparison
Indonesians
Immigrants from Cuba
32.4%
SINGLE MOTHER POVERTY
0.0/ 100
METRIC RATING
284th/ 347
METRIC RANK
30.1%
SINGLE MOTHER POVERTY
6.9/ 100
METRIC RATING
223rd/ 347
METRIC RANK
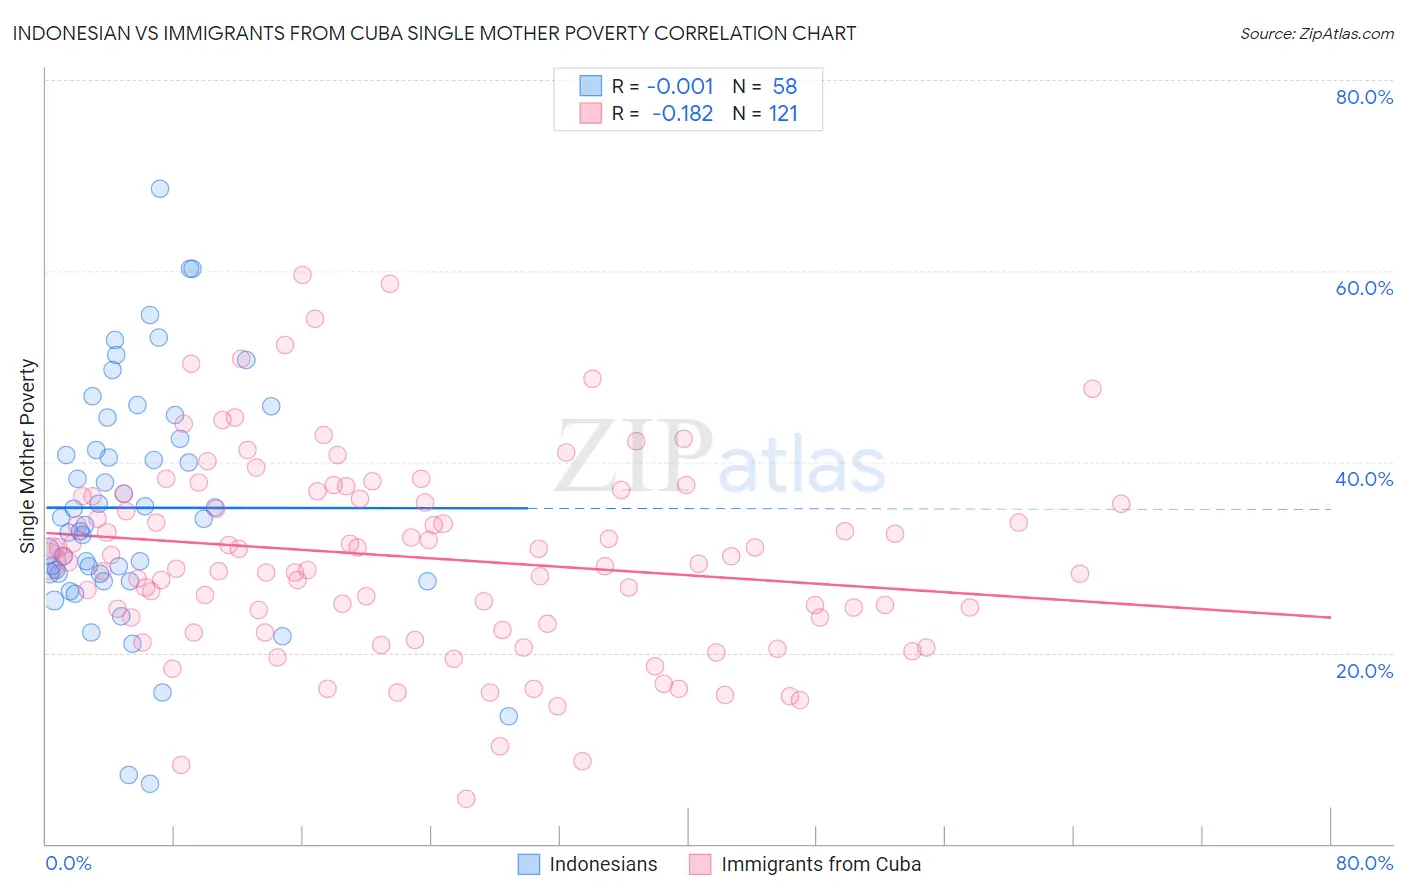
Indonesian vs Immigrants from Cuba Single Mother Poverty Correlation Chart
The statistical analysis conducted on geographies consisting of 161,147,773 people shows no correlation between the proportion of Indonesians and poverty level among single mothers in the United States with a correlation coefficient (R) of -0.001 and weighted average of 32.4%. Similarly, the statistical analysis conducted on geographies consisting of 320,148,902 people shows a poor negative correlation between the proportion of Immigrants from Cuba and poverty level among single mothers in the United States with a correlation coefficient (R) of -0.182 and weighted average of 30.1%, a difference of 7.7%.
Single Mother Poverty Correlation Summary
| Measurement | Indonesian | Immigrants from Cuba |
| Minimum | 6.2% | 4.7% |
| Maximum | 68.6% | 59.5% |
| Range | 62.4% | 54.9% |
| Mean | 35.2% | 30.0% |
| Median | 33.7% | 29.6% |
| Interquartile 25% (IQ1) | 28.2% | 23.4% |
| Interquartile 75% (IQ3) | 42.4% | 36.4% |
| Interquartile Range (IQR) | 14.2% | 13.0% |
| Standard Deviation (Sample) | 12.5% | 10.3% |
| Standard Deviation (Population) | 12.4% | 10.2% |
Similar Demographics by Single Mother Poverty
Demographics Similar to Indonesians by Single Mother Poverty
In terms of single mother poverty, the demographic groups most similar to Indonesians are Immigrants from Latin America (32.4%, a difference of 0.11%), Yup'ik (32.5%, a difference of 0.19%), Spanish American (32.3%, a difference of 0.30%), Immigrants from Dominica (32.5%, a difference of 0.31%), and Somali (32.6%, a difference of 0.54%).
| Demographics | Rating | Rank | Single Mother Poverty |
| Mexican American Indians | 0.0 /100 | #277 | Tragic 31.9% |
| Immigrants | Zaire | 0.0 /100 | #278 | Tragic 32.0% |
| Marshallese | 0.0 /100 | #279 | Tragic 32.1% |
| Immigrants | Nonimmigrants | 0.0 /100 | #280 | Tragic 32.2% |
| Cree | 0.0 /100 | #281 | Tragic 32.2% |
| Immigrants | Azores | 0.0 /100 | #282 | Tragic 32.2% |
| Spanish Americans | 0.0 /100 | #283 | Tragic 32.3% |
| Indonesians | 0.0 /100 | #284 | Tragic 32.4% |
| Immigrants | Latin America | 0.0 /100 | #285 | Tragic 32.4% |
| Yup'ik | 0.0 /100 | #286 | Tragic 32.5% |
| Immigrants | Dominica | 0.0 /100 | #287 | Tragic 32.5% |
| Somalis | 0.0 /100 | #288 | Tragic 32.6% |
| U.S. Virgin Islanders | 0.0 /100 | #289 | Tragic 32.6% |
| Osage | 0.0 /100 | #290 | Tragic 32.6% |
| Guatemalans | 0.0 /100 | #291 | Tragic 32.9% |
Demographics Similar to Immigrants from Cuba by Single Mother Poverty
In terms of single mother poverty, the demographic groups most similar to Immigrants from Cuba are Immigrants from Sudan (30.1%, a difference of 0.070%), Spanish (30.1%, a difference of 0.10%), Sudanese (30.0%, a difference of 0.13%), Immigrants from Eritrea (30.0%, a difference of 0.14%), and Scottish (30.1%, a difference of 0.16%).
| Demographics | Rating | Rank | Single Mother Poverty |
| Immigrants | Western Africa | 11.5 /100 | #216 | Poor 29.9% |
| Immigrants | Ghana | 11.3 /100 | #217 | Poor 29.9% |
| Hungarians | 10.3 /100 | #218 | Poor 29.9% |
| Finns | 9.3 /100 | #219 | Tragic 30.0% |
| Germans | 8.8 /100 | #220 | Tragic 30.0% |
| Immigrants | Eritrea | 7.7 /100 | #221 | Tragic 30.0% |
| Sudanese | 7.6 /100 | #222 | Tragic 30.0% |
| Immigrants | Cuba | 6.9 /100 | #223 | Tragic 30.1% |
| Immigrants | Sudan | 6.5 /100 | #224 | Tragic 30.1% |
| Spanish | 6.3 /100 | #225 | Tragic 30.1% |
| Scottish | 6.0 /100 | #226 | Tragic 30.1% |
| Immigrants | Liberia | 5.9 /100 | #227 | Tragic 30.1% |
| Spaniards | 5.4 /100 | #228 | Tragic 30.2% |
| Immigrants | Barbados | 5.0 /100 | #229 | Tragic 30.2% |
| English | 4.8 /100 | #230 | Tragic 30.2% |